Madison Schools 2016 Property Tax Increase Referendum – Let’s Compare: Madison and Middleton Property Taxes
The Madison School District is considering another property tax increase referendum for the upcoming November election.
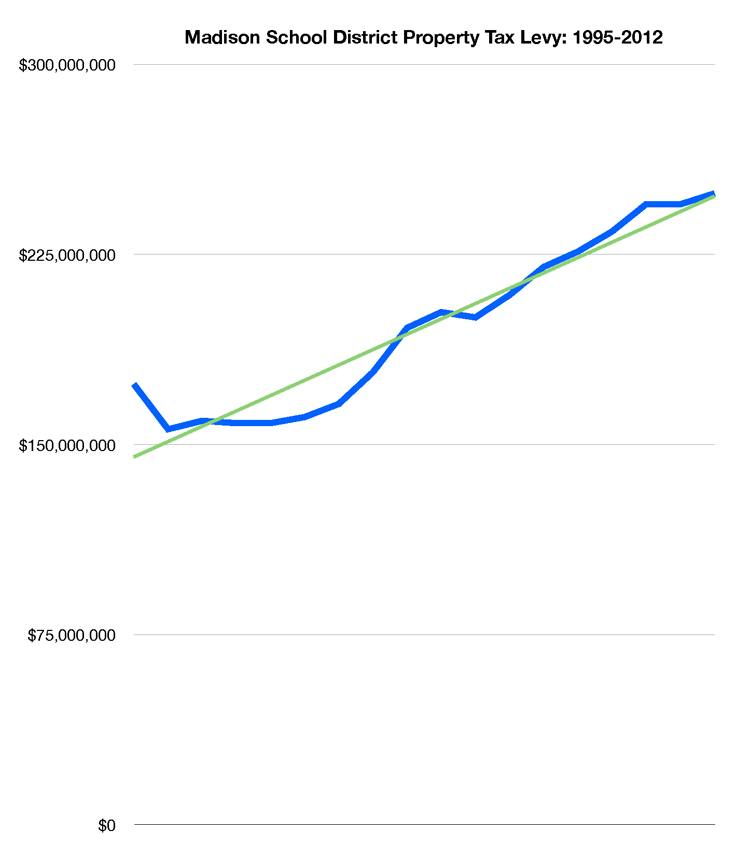
We’ve long spent more than most districts (“plenty of resources”), despite challenging academic outcomes. I thought it might be useful to revisit the choices homeowners and parents make. I’ve compared two properties, one in Middleton (2015 assessment: $257,500.00) and the other in Madison (2015 assessment slightly less: $249,300.00).
A Middleton parent/homeowner pays less over the years, with the difference growing significantly in recent times (note that my example Madison property features a 3.2% lower assessed value).
Tap to view a larger version of these images.
It is useful to review the assumptions in the District’s limited 2017-2019 budget disclosure document (lacks total spending….) 900K PDF. Related memo and proposed language.
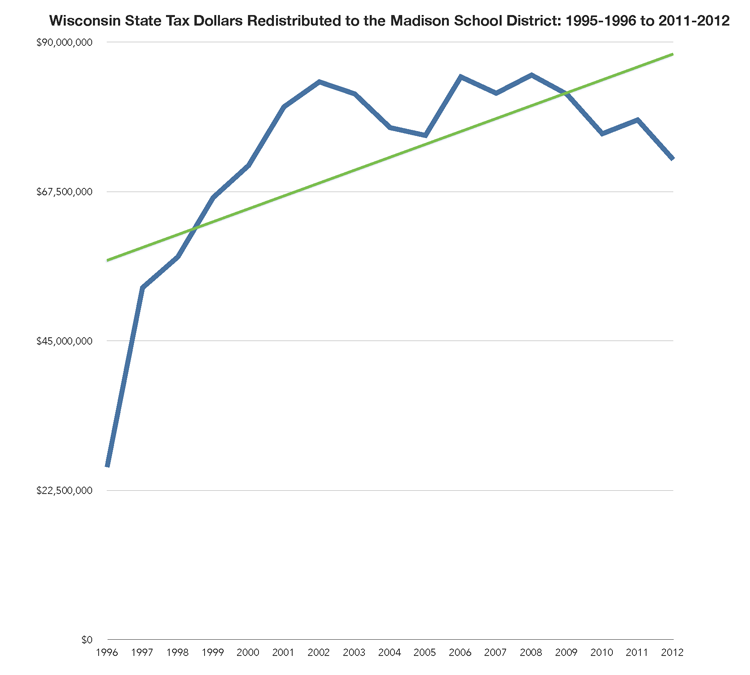
Wisconsin redistributed taxpayer K-12 (and higher ed) spending: 2004-2014. Details below:
Tap for a larger version. Excel or Numbers versions.
Madison Schools’ 2013-2014 budget, charts, documents, links, background and missing numbers:
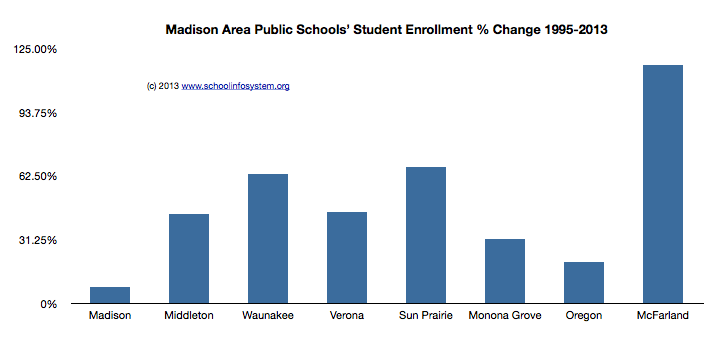
Where have all the students gone?
In closing, I’ve found that full budget information is much easier to find and review from Boston (spends more, but has lots of student choice) and Long Beach (spends quite a bit less per student, but offers more student choice).
Superintendent Jennifer Cheatham mentioned Boston and Long Beach as urban districts that have narrowed the achievement gap. Both districts offer a variety of school governance models, which is quite different than Madison’s long-time “one size fits all approach”.


