Search Results for: 2013-2014 budget per student middleton
Madison Schools 2016 Property Tax Increase Referendum – Let’s Compare: Madison and Middleton Property Taxes
The Madison School District is considering another property tax increase referendum for the upcoming November election. We’ve long spent more than most districts (“plenty of resources”), despite challenging academic outcomes. I thought it might be useful to revisit the choices homeowners and parents make. I’ve compared two properties, one in Middleton (2015 assessment: $257,500.00) and […]
Madison School District’s 2015-2016 Budget Goals & Priorities (Publish Total Spending?)
Madison School District (PDF): A. Alignment to Strategic Framework- In our vision to make every school a thriving school that prepares every student to be ready for college, career and community, these budget resources support the district’s goals and priorities as defined in our Strategic Framework. B. More equitable use of resources- As opposed to […]
Madison Schools’ 2014-2015 $402,464,374 Budget Document (April, 2014 version)
The Madison School District (3MB PDF): Five Priority Areas (just like the “Big 10”) but who is counting! – page 6: – Common Core – Behavior Education Plan – Recruitment and hiring – New educator induction – Educator Effectiveness – Student, parent and staff surveys – Technology plan 2014-2015 “budget package” 3MB PDF features some […]
Compare Madison Area Property Taxes
The Wisconsin State Journal offers a page to compare property taxes on a $200,000 home, here.
Related:
Madison’s 2013-2014 budget and commentary on Madison and Surrounding School Districts; Middleton’s lower Property Taxes.
Much more, here.
Madison spends about $15K per student, roughly double the national K-12 average, yet has long generated disastrous reading results.


Minneapolis Property Taxes are over 50% less than Madison’s on a Similar Home; Mayoral Election Education Commentary
A cynic would be forgiven for wondering whether the press conference Minneapolis mayoral candidate Mark Andrew held Monday afternoon, flanked by five members of the school board, was at least partly an exercise in damage control.
At the session, held in the library at Windom Dual Immersion School in southwest Minneapolis, Andrew announced a three-pronged education agenda. At its center: a promise to convene a collaborative headed by education advocates with divergent philosophies, Mike Ciresi and Louise Sundin.
“The conversation about improving educational outcomes for kids of color has gotten extremely polarized and increasingly heated in the past several years,” Andrew explained in the plan. “The reformers vs. unions dichotomy is unproductive, and doesn’t serve the best interests of our children or find Minneapolis solutions to the problems in Minneapolis’ schools.”Minneapolis plans to spend $524,944,868 (PDF budget book) during the 2013-2014 school year for 34,148 students or 15,364 per student, about the same as Madison.
Yet, property taxes are substantially lower in Minneapolis where a home currently on the market for $279,900 has a 2013 property tax bill of $3,433. A $230,000 Madison home pays $5,408.38 while a comparable Middleton home pays $4,648.18 in property taxes. Madison plans to increase property taxes 4.5% this year, after a 9% increase two years ago, despite a substantial increase in redistributed state tax dollar receipts. Yet, such history is often ignored during local tax & spending discussions. Madison Superintendent Cheatham offers a single data point response to local tax & spending policy, failing to mention the substantial increase in state tax receipts the year before:When we started our budget process, we received the largest possible cut in state aid, over $8 million,” Cheatham said. “I’m pleased that this funding will make up a portion of that cut and help us accomplish what has been one of our goals all along: to reduce the impact of a large cut in state aid on our taxpayers.”
A bit more background.
Madison’s Proposed Property Tax Increase: Additional links, notes and emails
I received a kind email from Madison School Board President Ed Hughes earlier today regarding the proposed property tax increase associated with the 2013-2014 District budget.
Ed’s email:Jim —
Your comparison to the tax rates in Middleton is a bit misleading. The Middleton-Cross Plains school district that has a mill rate that is among the lowest in Dane County. I am attaching a table (.xls file) that shows the mill rates for the Dane County school districts. As you will see, Madison’s mill rate is lower than the county average, though higher than Middleton’s. (Middleton has property value/student that is about 10% higher than Madison, which helps explain the difference.)
The table also includes the expenses/student figures relied upon by DPI for purposes of calculating general state aid for the 2012-13 school year. You may be surprised to see that Madison’s per-student expenditures as measured for these purposes is among the lowest in Dane County. Madison’s cost/student expenditures went up in the recently-completed school year, for reasons I explain here: http://tinyurl.com/obd2wty
EdMy followup email:
Hi Ed:
Thanks so much for taking the time to write and sending this along – including your helpful post.
I appreciate and will post this information.
That said, and as you surely know, “mill rate” is just one part of the tax & spending equation:
1. District spending growth driven by new programs, compensation & step increases, infinite campus, student population changes, open enrollment out/in,
2. ongoing “same service” governance, including Fund 80,
3. property tax base changes (see the great recession),
4. exempt properties (an issue in Madison) and
5. growth in other property taxes such as city, county and tech schools.
Homeowners see their “total” property taxes increasing annually, despite declining to flat income. Middleton’s 16% positive delta is material and not simply related to the “mill rate”.
Further, I continue to be surprised that the budget documents fail to include total spending. How are you evaluating this on a piecemeal basis without the topline number? – a number that seems to change every time a new document is discussed.
Finally, I would not be quite as concerned with the ongoing budget spaghetti if Madison’s spending were more typical for many districts along with improved reading results. We seem to be continuing the “same service” approach of spending more than most and delivering sub-par academic results for many students. (Note the recent expert review of the Madison schools Analysis: Madison School District has resources to close achievement gap.)
That is the issue for our community.
Best wishes,
Jim
Related: Middleton-Cross Plains’ $91,025,771 2012-2013 approved budget (1.1mb PDF) for 6,577 students, or $13,840.01 per student, roughly 4.7% less than Madison’s 2012-2013 spending.
45% (!) Increase in Madison Schools’ Fund 80 Property Taxes from the 2011-2012 to 2012-2013 School Year; No Mention of Total Spending
July, 2013 Madison Schools 2013-2014 Budget Presentation (PDF). Notes:
- No mention of total spending…. How might the Board exercise its oversight obligation without the entire picture?
- The substantial increase in redistributed state tax dollars (due to 4K) last year is not mentioned. Rather, a bit of rhetoric: “The 2013-14 budget development process has focused on actions which begin to align MMSD resources with the Strategic Framework Priorities and strategies to manage the tax levy in light of a significant loss of state aid.” In fact, according to page 6, the District expects to receive $46,392,012 in redistributed state tax dollars, which is a six (6%) increase over the funds received two years ago.
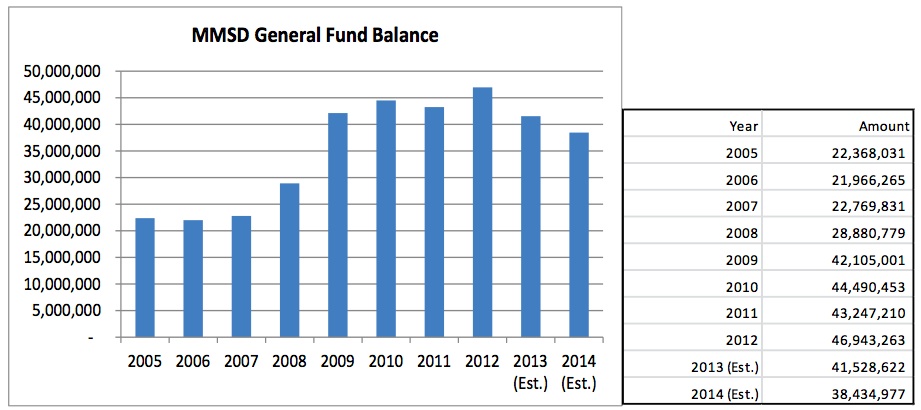
- The District’s fund equity (financial cushion, or reserves) has more than doubled in the past eight years, from $22,368,031 in 2005 to $46,943,263 in 2012.
- Outbound open enrollment continues to grow, up 14% to 1,041 leavers in 2013 (281 inbound from other Districts).

- There is no mention of the local tax or economic base:
- The growth in Fund 80 (MSCR) property taxes and spending has been controversial over the years. Fund 80, up until recently was NOT subject to state imposed property tax growth limitations.
- Matthew DeFour briefly summarizes the partial budget information here. DeFour mentions (no source referenced or linked – in 2013?) that the total 2013-2014 budget will be $391,000,000. I don’t believe it:
The January, 2012 budget document mentioned “District spending remains largely flat at $369,394,753” (2012-2013), yet the “baseline” for 2013-2014 mentions planned spending of $392,807,993 “a decrease of $70,235 or (0.02%) less than the 2012-13 Revised Budget” (around $15k/student). The District’s budget generally increases throughout the school year, growing 6.3% from January, 2012 to April, 2013. Follow the District’s budget changes for the past year, here.
Finally, the document includes this brief paragraph:
Work will begin on the 2014-15 early this fall. The process will be zero-based, and every line item and FTE will be carefully reviewed to ensure that resources are being used efficiently. The budget development process will also include a review of benefit programs and procurement practices, among other areas.
One hopes that programs will indeed be reviewed and efforts focused on the most urgent issues, particularly the District’s disastrous reading scores.
Ironically, the recent “expert review” found that Analysis: Madison School District has resources to close achievement gap. If this is the case (and I agree with their conclusion – making changes will be extraordinarily difficult), what are students, taxpayers and citizens getting for the annual tax & spending growth?
I took a quick look at property taxes in Middleton and Madison on a $230,000 home. A Middleton home paid $4,648.16 in 2012 while a Madison home paid 16% more, or $5,408.38.

Madison Schools’ 2013-2014 Budget Charts, Documents, Links, Background & Missing Numbers
Sources:
- General and Categorical Aid – Payments to School Districts
- WISTAX Facts & Figures
- Madison Schools 2013-2014 June 10, 2013 Budget Discussion Document (PDF)
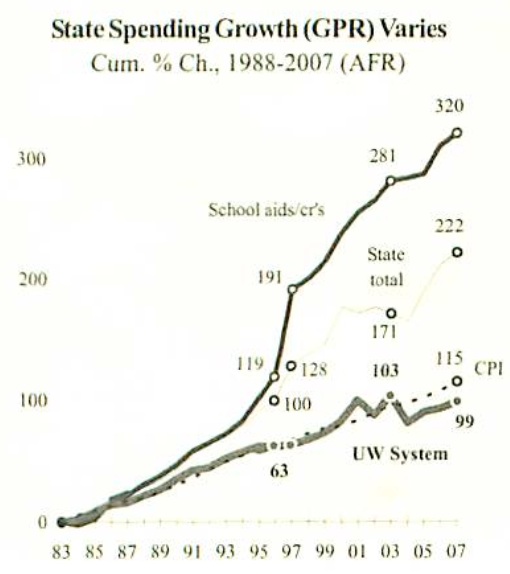
- Wisconsin State Tax Based K-12 Spending Growth Far Exceeds University Funding
- Up, Down & Transparency: Madison Schools Received $11.8M more in State Tax Dollars last year, Local District Forecasts a Possible Reduction of $8.7M this Year – March, 2013. The June 10, 2013 District budget document (PDF) fails to mention the previous year’s large increase in redistributed State of Wisconsin tax dollars:
Like all Wisconsin school districts, MMSD relies upon a state-local funding partnership. The actions of one partner greatly impact the other partner. The 2013-14 MMSD budget anticipates a major funding loss for MMSD (a loss of $8.7 in equalization aid) which shifts the funding burden onto the local property taxpayer.
The charts reveal several larger stories:
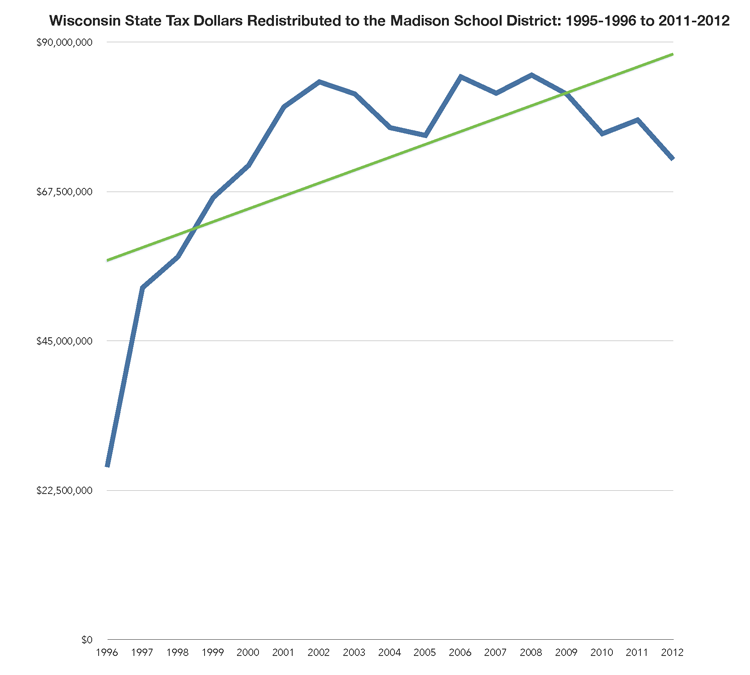
First, the State of Wisconsin “committed” to 2/3 K-12 funding in the mid-1990’s. The increase in redistributed state tax dollars is apparent. [Wisconsin Legislative Fiscal Bureau: State Aid to School Districts (PDF)]
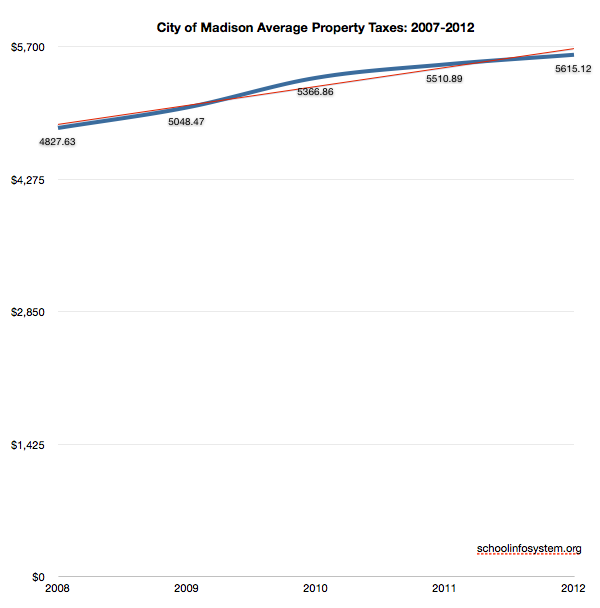
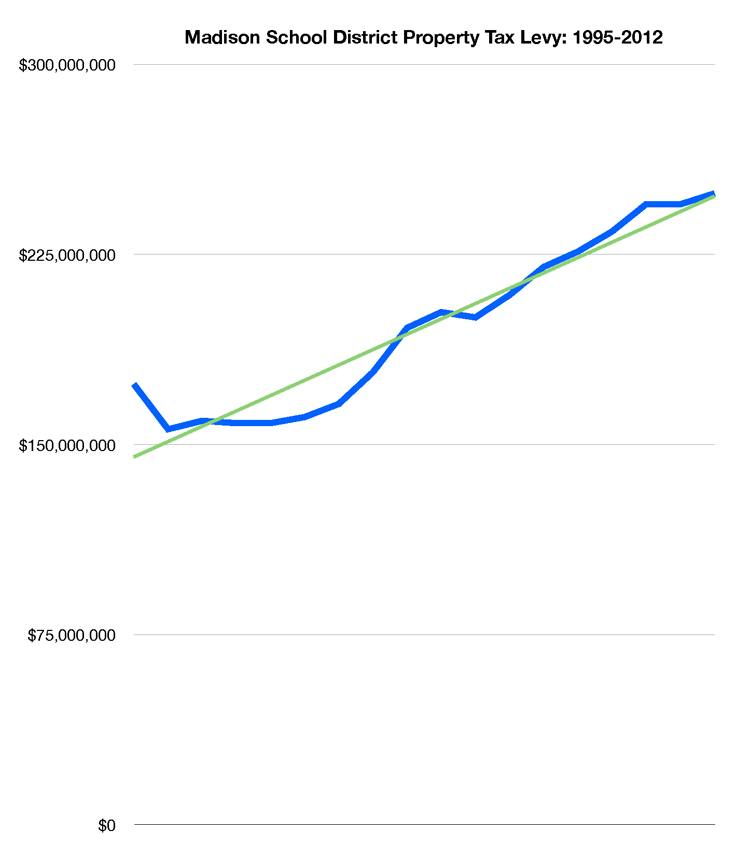
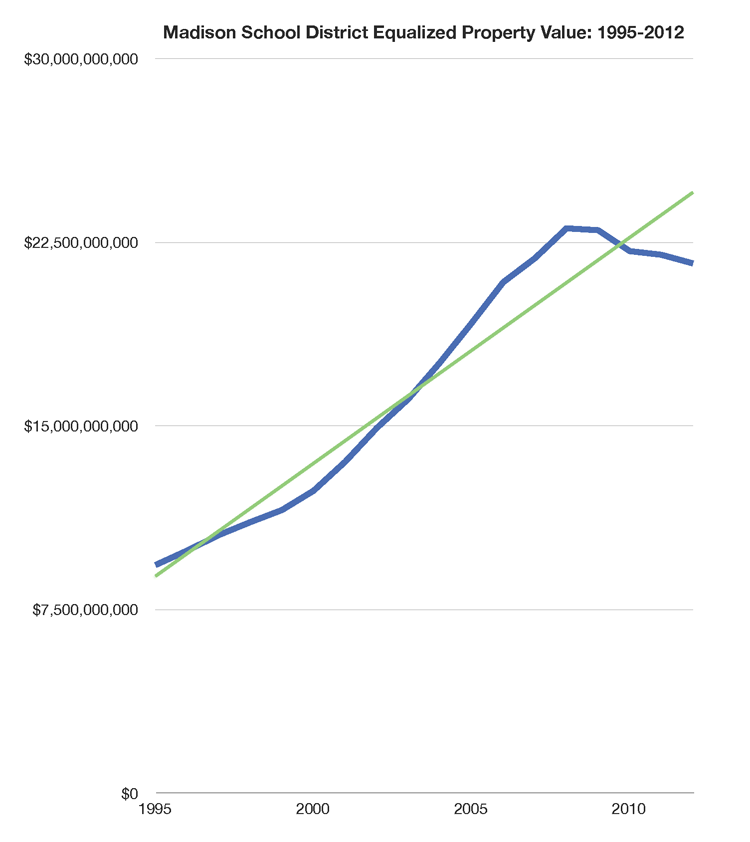
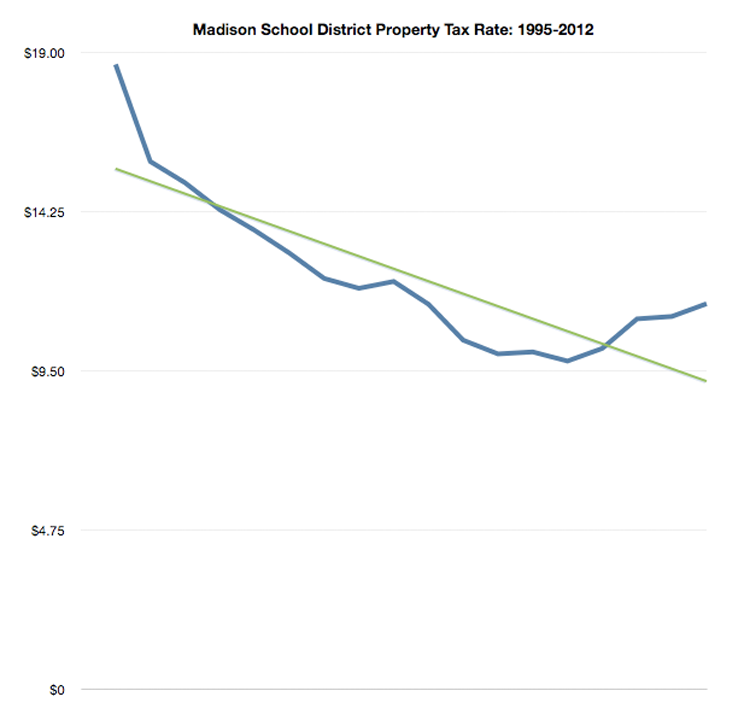
Second, Madison’s substantial real estate growth during the 2000’s supported growing K-12 spending while reducing the property tax rate (the overall pie grew so the “rate” could fall somewhat). The real estate music stopped in the late 2000’s (“Great Recession) and the tax rate began to grow again as the District consistently raised property taxes. *Note that there has been justifiable controversy over Madison’s large number of tax exempt properties. Fewer exemptions expands the tax base and (potentially) reduces individual homeowner’s taxes.
Third, Madison has long spent more per student than most public schools.
Fourth, the District’s June 10, 2013 budget document fails to address two core aspects of its mission: total spending and program effectiveness. The most recent 2012-2013 District budget number (via a Matthew DeFour email) is $392,789,303. This is up 4.4% from the July, 2012 District budget number: $376,200,000. The District’s budget has always – in my nine years of observation – increased throughout the school year. The late, lamented “citizen’s budget” was a short lived effort to create a standard method to track changes over time.
Fifth, the June 10, 2013 document does not include the District’s “Fund balance” or equity. The balance declined during the 2000’s, somewhat controversially, but it has since grown. A current number would be useful, particularly in light of Madison’s high property taxes.
Sixth, I took a quick look at property taxes in Middleton and Madison on a $230,000 home. A Middleton home paid $4,648.16 in 2012 while a Madison home paid 16% more, or $5,408.38. Local efforts to significantly increase property taxes may grow the gap with Middleton.
Finally, years of spending and tax growth have not addressed the District’s long term-disastrous reading results. Are we doing the same thing over and over?
Choice, Not More Spending, Is Key To Better Schools; Wisconsin 12th in Spending, 24th in Achievement
W. Michael Cox & Richard Alm Education looms as both cause and cure for the decline of the middle class and the widening gap between rich and poor. In today’s knowledge-based economy, poorly performing public schools leave many U.S. workers ill-equipped for jobs that pay middle-class wages. So it follows that improving education is the […]
Wisconsin school spending grew 10.2% during 2008-11, compared to 2.9% nationally, according to newly available Census figures
Despite cuts to state school aid in 2010, and slower growth of school revenue limits in 2010 and 2011, Wisconsin per student spending increased 2.6% in 2010 and 3.6% in 2011. Wisconsin school spending averaged $11,774 per student in 2011, 15th highest nationally and 11.5% above the national average ($10,560).
What is not yet known (since federal data have a two year lag) is how Wisconsin will stack up with other states in light of state budget actions in 2011-13. However, researchers from the Wisconsin Taxpayers Alliance (WISTAX) estimate that the 5.5% cut in 2012 Wisconsin school revenue limits will trim spending to $11,126 per student, potentially shrinking the gap between school spending here and nationally. WISTAX is a nonpartisan, nonprofit research organization dedicated to policy research and citizen education.
The new federal figures for 2011 show that, unlike Wisconsin, many states saw declining combined aid (state and federal) to schools during 2009-11; 11 states in 2009, 17 in 2010, and 22 in 2011. By contrast, state-federal support in Wisconsin rose 3.3% in 2009, 0.4% in 2010, and 2.7% in 2011.
The difference in aid trends between Wisconsin and the nation was reflected in per pupil expenditures. U.S. school spending grew 2.3% in 2009 and 1.1% in 2010, before falling 0.5% in 2011. In Wisconsin, however, per student spending during those years rose 3.7%, 2.6%, and 3.6%, respectively.
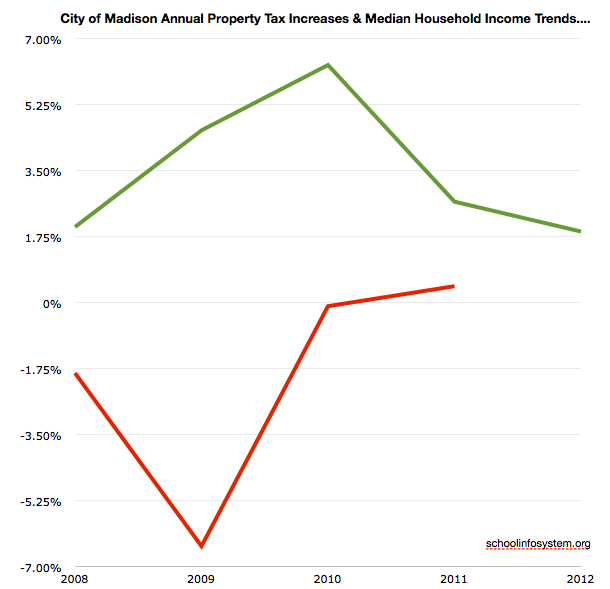
Many states trimmed school spending during 2009-11. Two states made cuts in all three years, and another seven cut spending in both 2010 and 2011. As national figures have already suggested, retrenchment did not occur in Wisconsin until 2012.Related: A Look at Property Taxes Around the World and Madison’s 16% increase since 2007; Median Household Income Down 7.6%; Middleton’s 16% less and Madison School Board Passes 2013-2014 Budget, including a 4.5% Property Tax Increase.