Search Results for: 2013-2014 per student
HS Graduation Rates Go Up Even as Students and Teachers Fail to Show Up
Max Diamond Phelps reflects a national trend in which high schools across the country have both high absenteeism and high graduation rates. A recent national study by the U.S. Department of Education showed that about one in sevenstudents missed 15 days or more during the 2013-14 school year – the year before the national high school graduation […]
Madison Schools 2016 Property Tax Increase Referendum – Let’s Compare: Madison and Middleton Property Taxes
The Madison School District is considering another property tax increase referendum for the upcoming November election. We’ve long spent more than most districts (“plenty of resources”), despite challenging academic outcomes. I thought it might be useful to revisit the choices homeowners and parents make. I’ve compared two properties, one in Middleton (2015 assessment: $257,500.00) and […]
Madison has the lowest student to licensed staff ratio among the five largest Wisconsin school districts
Madison School District Administration (PDF): Some of the ways in which MMSD has invested in people include: Increased the number of PK-12 staff from 3,497 in 2008-09 to 4,027 in 2013-14. This effectively grew the district’s total employees by 15% over 5 years (largely due to 4K implementation during this time), while maintaining a student […]
Are we being over-optimistic when it comes to how well NJ’s middle-class students are being prepared for college?
Laura Waters: These days “education reform” is a loaded phrase, evoking politically charged disruptions of cherished institutions, Christie-ish harassment of honorable educators, and testing-mania. Certainly, if our schools are fine, we don’t have to change. If they’re not but we pretend they are, then we’re doing our children a disservice. As Mark Twain said, “denial […]
Chinese Students at U.S. Universities Jump 75% in Three Years
Janet Lorin: In 2013-2014, the number of Chinese students in the U.S. rose 8.1 percent from a year earlier, while those from India swelled by 17 percent, the IIE said. Foreigners are attractive to colleges because they bring diversity to campuses and many pay full freight. That’s a boon to schools, which doled out about […]
Teacher Union Money Talks: NEA and AFT together spend roughly $700 million per year
Dmitri Mehlhorn: One of the most-hotly debated questions is how strong is the National Education Association and the American Federation of Teachers compared to the school reform movement. When it comes to the money that is key to political influence, there is no doubt: The NEA and AFT together spend roughly $700 million per year, […]
Madison’s Lengthy K-12 Challenges Become Election Grist; Spends 22% more per student than Milwaukee
Madison 2005 (reflecting 1998): When all third graders read at grade level or beyond by the end of the year, the achievement gap will be closed…and not before On November 7, Superintendent Art Rainwater made his annual report to the Board of Education on progress toward meeting the district’s student achievement goal in reading. As […]
Madison Schools Float 3.87% Property Tax Increase for the 2014-2015 $402,464,374 budget
Madison School District 600K PDF: July 1 Equalization Aid estimate was $4.8 million less than budget. Before any cost cutting, the November 2014 tax levy estimate would change from a 1.99% increase to a 3.86% increase. However, the November 2014 tax base estimate has also changed from a 0.0% increase to a 3.5% increase. This […]
Segregation Now: In Tuscaloosa today, nearly one in three black students attends a school that looks as if Brown v. Board of Education never happened.
Nikole Hannah-Jones: Though James Dent could watch Central High School’s homecoming parade from the porch of his faded white bungalow, it had been years since he’d bothered. But last fall, Dent’s oldest granddaughter, D’Leisha, was vying for homecoming queen, and he knew she’d be poking up through the sunroof of her mother’s car, hand cupped […]
Madison Schools’ 2014-2015 Budget Update; Assumes 16% Increase in Redistributed State Tax Dollars, 2.11% Property Tax Growth; About $400,000,000 for 27,186 students
The Madison School District (600K PDF): This is the fourth and final installment of the series of updates designed to keep the board informed during the 2014-15 MMSD budget development process. The first update reviewed the budget process, priorities, and expected revenues. The second update explained our goals for a school-based staffing process that was […]
A Positive Madison Magazine Article on Superintendent Jennifer Cheatham
Deanna Wright: Last April, and to a remarkable amount of fanfare, Jennifer Cheatham became the superintendent of the Madison Metropolitan School District. From the very start, the community has opened its arms to welcome her. When I interviewed her for Madison Magazine TV last month, I was aware that the community, especially parents of color, […]
A few “Tweets” on Madison Superintendent Jennifer Cheatham’s Meeting with the Wisconsin State Journal
@jimzellmer She sees "lack of focus" as problem. District "has spread itself too thin." Throws so many strategies at problem. @MollyBeckWSJ
— Scott Milfred (@ScottMilfred) January 16, 2014
@jimzellmer On teaching and learning, district will now "execute on a few things & do them really well." @MollyBeckWSJ
— Scott Milfred (@ScottMilfred) January 16, 2014
I’m glad to see the apparent focus on doing a few things well. This is the only way forward given the District’s disastrous reading results. That said, I was disappointed when the new Superintendent largely continued the “same service” budget approach during the 2013-2014 financial discussions.
The District’s 2x per student spending (above the national average) has supported numerous initiatives, likely preventing a focus on those that are truly meaningful for our students. For example, Kerry Motoviloff noted that Madison Schools Administration has “introduced more than 18 programs and initiatives for elementary teachers since 2009”. Steven Sinofsky’s latest is also worth reading in this context.
Tale of two Kentucky schools: Barbourville gets $8,362 per student; Anchorage gets $19,927
Public schools in this Appalachian town pocked with shuttered factories and vacant storefronts got an average of $8,362 to spend on each student’s education in 2013, the least they had gotten in five years.
Several hours away, at the public K-8 school in the wealthy Jefferson County suburb of Anchorage, revenue rose slightly to $19,927 per student, more than twice as much as Barbourville’s.
Everything looks better in Anchorage: teachers’ salaries and experience levels, class sizes, textbooks, computer access, test scores and the future in general. After eighth grade, Anchorage students can go to a number of fine private academies. Or, if their parents desire, they can bypass Louisville’s sometimes troubled urban classrooms for public high school in affluent Oldham County, 10 miles down the road.
“The model we have here is really working,” said Anchorage school superintendent Kelley Ransdell.
In Barbourville, the locals are proud of their independent “city school,” as they call it, a small campus enrolling about 700 mostly poor children from preschool to 12th grade. But they don’t fool themselves about where it ranks.
There’s no money for pay raises and little for arts programs unless parents raise it themselves. There are a handful of desktop computers, outdated in the iPad era. There’s no state aid for textbooks, so the books on hand are few, old and worn. When new books became essential last year to teach modern “division math” at the elementary school, officials lifted $19,276 from the building repair fund.Locally, Madison plans to spend about $15k/student during the 2013-2014 school year.
Central Valley California School District Develops Education Success Formula; Graduates 94% of Hispanic Students; Spends 50% less than Madison per student
When Yadir Sanchez arrived in this San Joaquin Valley agricultural town at age 5, she joined a well-traveled path to academic failure that children of other Mexican farmworkers had been on for years.
Students like Sanchez – poor, Hispanic and barely bilingual – routinely fell through the cracks in the Sanger Unified School District, which had one of the worst records in the state. Lacking basic math and English skills, students were pushed into trades or allowed to drop out.
Sanchez appeared to be no different, speaking only Spanish in kindergarten and struggling with English until fifth grade.
But something remarkable happened that lifted the fortunes of Sanchez and so many like her. The district reinvented itself, making huge strides by shaking up the way teachers worked with students, parents and each other.
In 2012, the district graduated 94 percent of its Hispanic students, 20 percentage points higher than the state average and similar districts. Its Hispanic dropout rate was just 3 percent, compared to 18 percent statewide.
Sanger’s success is still the exception across California. While Latinos are poised to become the state’s largest ethnic group in 2014, they continue to score lower on standardized tests, graduate at lower rates and drop out more often than other students.
Gov. Jerry Brown recently signed legislation that will funnel more money to help poorer schools, but Sanger’s success serves as a model for how a district made vast gains despite budget cuts.Take Sanger Unified, for one. Six years ago, the achievement gap between whites in Sanger and whites in Fresno stood at 57 points on the API test. Today, the gap has widened to 78 points. Whites in Sanger score 892 points on the API compared to 814 points for whites in Fresno. The gap between Latinos, by far the majority population in both districts, is even wider. Latinos in Sanger score 811 on the API compared to 708 for Latinos in Fresno. The most stunning gap — a gulf really — can be seen in the black community. Blacks in Sanger score 821 while blacks in Fresno score 665. That’s a 156-point difference in two districts whose headquarters sit a few miles apart.
Sanger will spend $80,795,175 for 11,000 students during the 2013-2014 school year (PDF Budget document), or $7,345 per student. That is about half the amount Madison spends per student (!) and similar to the national average.
Sanger’s “Academic Performance Index“. Demographic comparison: Sanger | Madison.
Sanger high school offers 14 AP courses.
Madison’s substantial per student spending continues, despite long term disastrous reading results.
Compare Madison Area Property Taxes
The Wisconsin State Journal offers a page to compare property taxes on a $200,000 home, here.
Related:
Madison’s 2013-2014 budget and commentary on Madison and Surrounding School Districts; Middleton’s lower Property Taxes.
Much more, here.
Madison spends about $15K per student, roughly double the national K-12 average, yet has long generated disastrous reading results.


Latest Madison Schools’ 2013-2014 $391,834,829 Budget
The Board of Education must adopt a tax levy by November 6, 2013. We recommend a total tax levy for all Funds of $257,727,292. This is a 3.38% increase over the prior year, and a 1.09% decrease over the levy estimate included in the August 2013 preliminary budget. The Board’s ‘unused’ levy authority, which can be preserved and carried forward, is $8.9 million.
We also recommend that the Board adopt a Fall Budget for 2013-14 which will replace the preliminary budget approved in August. The Fall Budget has been updated to reflect the latest information regarding funding, grants, and actual staffing levels. A review of all budget line items was included in the update process, with adjustments made wherever necessary to improve the accuracy of the budget.
The materials included in this packet provide multiple layers of detail concerning the budget and tax levy, from the concise ‘DP! recommended budget format’ to more detailed views of the budget and levy.The current 2013-2014 budget spends $391,834,829 for 27,186 pk-12 students or $14,413/student. Note that per student spending is not linear for pre-k plus full time students.
Related: Madison’s Planned $pending & Property Tax Increase: Does it Include $75/Student “Unrestricted” State Budget Increase (Outside of Revenue Caps)?, 45% (!) Increase in Madison Schools’ Fund 80 Property Taxes from the 2011-2012 to 2012-2013 School Year; No Mention of Total Spending, Madison Schools’ 2013-2014 Budget Charts, Documents, Links, Background & Missing Numbers and Madison’s disastrous reading results.
Minneapolis Property Taxes are over 50% less than Madison’s on a Similar Home; Mayoral Election Education Commentary
A cynic would be forgiven for wondering whether the press conference Minneapolis mayoral candidate Mark Andrew held Monday afternoon, flanked by five members of the school board, was at least partly an exercise in damage control.
At the session, held in the library at Windom Dual Immersion School in southwest Minneapolis, Andrew announced a three-pronged education agenda. At its center: a promise to convene a collaborative headed by education advocates with divergent philosophies, Mike Ciresi and Louise Sundin.
“The conversation about improving educational outcomes for kids of color has gotten extremely polarized and increasingly heated in the past several years,” Andrew explained in the plan. “The reformers vs. unions dichotomy is unproductive, and doesn’t serve the best interests of our children or find Minneapolis solutions to the problems in Minneapolis’ schools.”Minneapolis plans to spend $524,944,868 (PDF budget book) during the 2013-2014 school year for 34,148 students or 15,364 per student, about the same as Madison.
Yet, property taxes are substantially lower in Minneapolis where a home currently on the market for $279,900 has a 2013 property tax bill of $3,433. A $230,000 Madison home pays $5,408.38 while a comparable Middleton home pays $4,648.18 in property taxes. Madison plans to increase property taxes 4.5% this year, after a 9% increase two years ago, despite a substantial increase in redistributed state tax dollar receipts. Yet, such history is often ignored during local tax & spending discussions. Madison Superintendent Cheatham offers a single data point response to local tax & spending policy, failing to mention the substantial increase in state tax receipts the year before:When we started our budget process, we received the largest possible cut in state aid, over $8 million,” Cheatham said. “I’m pleased that this funding will make up a portion of that cut and help us accomplish what has been one of our goals all along: to reduce the impact of a large cut in state aid on our taxpayers.”
A bit more background.
UP Academy Boston and UP Academy Leonard student achievement results from the spring 2013 MCAS.
Infographic, via a kind reader email:
After two years of operation, we are setting a new level of academic and behavioral expectations for our nearly 500 students. Today, our school environment promotes an atmosphere of rigor and joy and leads students to internalize important, positive lifelong values. We are proud of the progress that we have made, as we have many achievements to celebrate.
While we are excited about the work of our students and teachers in year two, we are poised to move from a turnaround school to a truly excellent school. Our mission is still alive: We will work with urgency until all of our students acquire the knowledge, skills and strength of character necessary to succeed on the path to college and to achieve their full potential. The 2013-2014 school year will be an extraordinary and critical one for our school community, as UP Academy aspires to do whatever it takes to create responsible and independent scholars.Related: Comparing Boston, Long Beach and Madison schools, and the rejected Madison Preparatory Academy IB Charter school.
Comparing Madison, Boston & Long Beach Public Schools: Student/Teacher Ratio
Madison Superintendent Jennifer Cheatham recently cited the Boston and Long Beach Schools for “narrowing their achievement gap” during a July, 2013 “What Will be Different This Time” presentation to the Madison Rotary Club.
As time permits, I intend to post comparisons between the Districts, starting today.
Student / Teacher Ratio
Per Student Annual Spending
Boston Schools’ budget information was, by far the easiest to find. Total spending is mentioned prominently, rather than buried in a mountain of numbers.
Finally, after I noticed that Madison’s student / teacher ratio is significantly lower than Boston, Long Beach and the Badger state average, I took a look at the Wisconsin DPI website to see how staffing has changed over the past few years. Madison’s licensed staff grew from 2,273 in 2007-2008 to 2,492 in 2011-2012.
What are the student achievement benefits of Madison’s very low ratio?
Related: Madison Schools’ 2013-2014 budget includes a 4.5% property tax increase after 9% two years ago.
“Plenty of resources” and “the Madison School District has the resources to close the achievement gap“.


Free dual enrollment is a big deal for many Roanoke students; Madison continues one size fits all approach
It’s now even easier and cheaper for local high school students to get a college education.
At a joint meeting between City Council, The Roanoke City School Board and Virginia Western the community college talked about it’s newest program.
Back in March, Virginia Western announced it’s waiving tuition for students taking dual enrollment classes.
Those are classes students can take in high school and earn college credit, but many students weren’t.
They can now.Related: Obtaining credit for non Madison School District Courses has been an ongoing challenge. Perhaps this issue has faded away as past practices die? Madison’s non-diverse or homogeneous governance model inflicts numerous costs, from one size fits all curricula to growth in the ‘burbs accompanied by ever increasing property taxes on top of stagnant or declining income.
Commentary on New Madison Superintendent Cheatham’s “Style”….
he gist of her framework is hard to argue. It calls for a renewed focus on learning, a school system that makes curriculum consistent across the district and better measures student and teacher performance. In sum, it is a back-to-basics approach that does not require new money, at least for now.
Madison, of course, has been grappling with its changing demographics where many students, especially minority children, struggle academically. In shorthand, it’s called the “achievement gap,” and the approach to date has been a long list of seemingly laudable, logical programs.
Now comes Cheatham saying we don’t need more money, at least not yet, but instead we need to rebuild the foundation. Might some see that as counterintuitive, I wonder?
“It might be,” she responds. “My take is that we were adding on with a big price tag to an infrastructure that was weak. … Does that make sense? The bones of the organization were weak and we didn’t do the hard work of making sure that the day-to-day processes … were strong before deciding to make targeted investments on top of a strong foundation.”
She continues: “That doesn’t mean that there won’t be some targeted investments down the line. I suspect that will be in things like technology, for instance, which is a real challenge … and is going to have a price tag later. I need to make sure that the foundation is strong first.”
Cheatham alludes to her Chicago experience. “Having worked with lots of schools — and lots of schools that have struggled — and worked with schools targeting narrowing and closure of the achievement gap, these fundamental practices” make the biggest difference. “It’s that day-to-day work that ultimately produces results and student learning.”We shall see. Local media have greeted prior Superintendents, including Cheryl Wilhoyte with style points, prior to the beginning of tough decision-making.
Related: The Dichotomy of Madison School Board Governance: “Same Service” vs. “having the courage and determination to stay focused on this work and do it well is in itself a revolutionary shift for our district”.
Another interesting governance question, particularly when changes to the 157 page teacher union contract, or perhaps “handbook” arise, is where the school board stands? Two seats will be on the Spring, 2014 ballot. They are presently occupied by Marj Passman and Ed Hughes. In addition, not all members may vote on teacher union related matters due to conflict of interests. Finally, Mary Burke’s possible race for the Governor’s seat (2014) may further change board dynamics.
I hope that Superintendent Cheatham’s plans to focus the organization on teaching become a reality. Nothing is more important given the District’s disastrous reading results. That said, talk is cheap and we’ve seen this movie before.
Superintendent Jennifer Cheatham cites previous lack of “long-term vision” in presenting 2013-14 budget for Madison schools
Cheatham said Madison schools have already implemented a variety of initiatives to increase student achievement but have not seen “measurable improvements.”
“It isn’t for lack of working very hard and doing a lot of things at once,” she said. “I feel pretty confident the reason that hasn’t occurred is because of the lack of long-term vision.”
Cheatham recommended the board focus on strengthening existing programs and infrastructure, which would not require new expenditures.
“I want to be more strategic and thoughtful about this than how we did it in the past,” she added.Much more on the Madison School District’s planned spending & property tax increases via the 2013-2014 budget, here.
Related: Analysis: Madison School District has resources to close achievement gap.
Madison’s Planned $pending & Property Tax Increase: Does it Include $75/Student “Unrestricted” State Budget Increase (Outside of Revenue Caps)?
Wisconsin Association of School Boards, via a kind reader’s email:
The 2013-15 state budget act provides for state categorical aid payments to each district of $75 per pupil in the first year and $150 per pupil in 2014-15 (reflecting $75 from the first year + an additional $75) and each year thereafter. (“Categorical aid” in this case simply means that it is received outside the revenue cap (as distinguished from general aid, which is under the revenue cap).
This per-pupil aid may be spent irrespective of the district’s revenue limit and can be used for any purpose. (Unlike most other categorical aid, it is not tied to any specific student population or program.) This aid will be received by all districts and is likely to be welcomed by high per-pupil property wealth districts that receive little general aid.
In addition, the 2013-15 state budget act provides for a $75 per-pupil increase in the revenue limit in each year. These increases add on top of one another (so $75 gets added to the base in the first year and another $75 on top gets added of that in the second year–for a total of $130 million in new revenue limit authority statewide). Note: The budget act makes no provision for a revenue limit adjustment in 2015-16 or thereafter.
Together, it is argued that the revenue limit adjustment and the per-pupil categorical aid will provide districts with an additional $150 per pupil in each year of the biennium. (While this $150 figure doesn’t equate to the inflationary adjustment contemplated by the WASB resolutions, it compares quite favorably with the $0 per-pupil “budget freeze” proposed in the budget as originally introduced.) Half of this increase ($75 per pupil) comes from an increase in revenue limits, while the remainder ($75 in the first year, and that $75 plus an additional $75 in the second year) comes from the new categorical aid that will benefit all school districts.
(Technically, the increase in spendable resources for most districts is actually $100 per pupil in the first year because the $50 per-pupil payment received by districts that levied to the max in 2012-13 was one-time money and goes away. For the 27 or so districts that didn’t qualify for the state matching money, the increase in additional resources over 2012-13 resources actually IS $150 per pupil. See Legislative Fiscal Bureau memo on this subject.)
Significantly, the per-pupil categorical aid that is provided to every district is permanent and will continue in 2014-15 and each school year thereafter. It is funded through a sum sufficient GPR appropriation, making it the first sum sufficient appropriation for public school districts since the state abandoned the statutory commitment to two-thirds funding in the 2003-05 state budget bill. Because this is a sum sufficient appropriation, the payments to individual school districts won’t be affected (e.g., pro-rated) by changes in statewide membership. The per-pupil amount is, in effect, guaranteed.) And unlike the $50 per-pupil categorical aid that was provided in 2012-13 to 397 school districts, there is no requirement that a district levy a certain amount in order to qualify for this categorical aid.
The calculation is also straightforward–each district aid is determined by using its three-year rolling average membership to calculate the number of pupils in each district times $75 per pupil. Thus, the $75 per student categorical aid payment in the coming year will be calculated on a current-year basis (using the current year membership count plus the two previous years). As a result, the DPI will have to wait until each district has completed its third Friday in September count in order to complete the calculation. School boards and school administrators who have to hold their annual meeting and get the levy approved by district electors by Oct. 31 should be able to calculate their district’s allotment.
Finally, the $75 per-pupil payment won’t be made by the state until the fourth Monday in March, so it isn’t likely to solve districts’ biggest cash flow issues, but will provide a needed boost.Much more on the Madison School District’s planned spending & property tax increases via the 2013-2014 budget, here.
Related: Analysis: Madison School District has resources to close achievement gap.
Madison’s Proposed Property Tax Increase: Additional links, notes and emails
I received a kind email from Madison School Board President Ed Hughes earlier today regarding the proposed property tax increase associated with the 2013-2014 District budget.
Ed’s email:Jim —
Your comparison to the tax rates in Middleton is a bit misleading. The Middleton-Cross Plains school district that has a mill rate that is among the lowest in Dane County. I am attaching a table (.xls file) that shows the mill rates for the Dane County school districts. As you will see, Madison’s mill rate is lower than the county average, though higher than Middleton’s. (Middleton has property value/student that is about 10% higher than Madison, which helps explain the difference.)
The table also includes the expenses/student figures relied upon by DPI for purposes of calculating general state aid for the 2012-13 school year. You may be surprised to see that Madison’s per-student expenditures as measured for these purposes is among the lowest in Dane County. Madison’s cost/student expenditures went up in the recently-completed school year, for reasons I explain here: http://tinyurl.com/obd2wty
EdMy followup email:
Hi Ed:
Thanks so much for taking the time to write and sending this along – including your helpful post.
I appreciate and will post this information.
That said, and as you surely know, “mill rate” is just one part of the tax & spending equation:
1. District spending growth driven by new programs, compensation & step increases, infinite campus, student population changes, open enrollment out/in,
2. ongoing “same service” governance, including Fund 80,
3. property tax base changes (see the great recession),
4. exempt properties (an issue in Madison) and
5. growth in other property taxes such as city, county and tech schools.
Homeowners see their “total” property taxes increasing annually, despite declining to flat income. Middleton’s 16% positive delta is material and not simply related to the “mill rate”.
Further, I continue to be surprised that the budget documents fail to include total spending. How are you evaluating this on a piecemeal basis without the topline number? – a number that seems to change every time a new document is discussed.
Finally, I would not be quite as concerned with the ongoing budget spaghetti if Madison’s spending were more typical for many districts along with improved reading results. We seem to be continuing the “same service” approach of spending more than most and delivering sub-par academic results for many students. (Note the recent expert review of the Madison schools Analysis: Madison School District has resources to close achievement gap.)
That is the issue for our community.
Best wishes,
Jim
Related: Middleton-Cross Plains’ $91,025,771 2012-2013 approved budget (1.1mb PDF) for 6,577 students, or $13,840.01 per student, roughly 4.7% less than Madison’s 2012-2013 spending.
45% (!) Increase in Madison Schools’ Fund 80 Property Taxes from the 2011-2012 to 2012-2013 School Year; No Mention of Total Spending
July, 2013 Madison Schools 2013-2014 Budget Presentation (PDF). Notes:
- No mention of total spending…. How might the Board exercise its oversight obligation without the entire picture?
- The substantial increase in redistributed state tax dollars (due to 4K) last year is not mentioned. Rather, a bit of rhetoric: “The 2013-14 budget development process has focused on actions which begin to align MMSD resources with the Strategic Framework Priorities and strategies to manage the tax levy in light of a significant loss of state aid.” In fact, according to page 6, the District expects to receive $46,392,012 in redistributed state tax dollars, which is a six (6%) increase over the funds received two years ago.
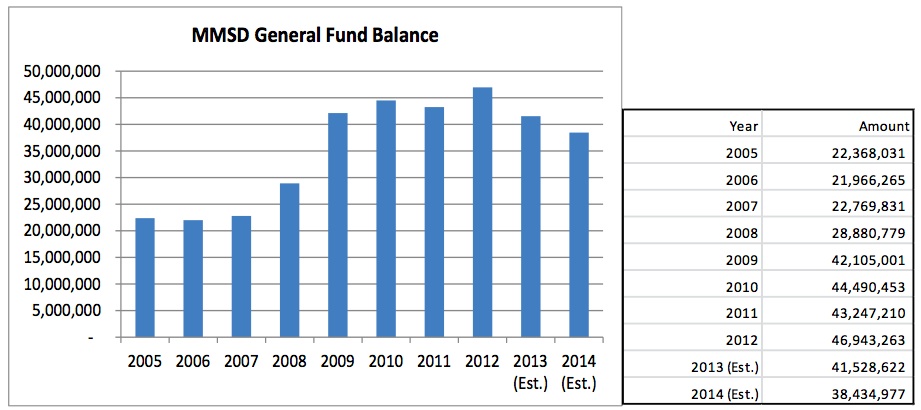
- The District’s fund equity (financial cushion, or reserves) has more than doubled in the past eight years, from $22,368,031 in 2005 to $46,943,263 in 2012.
- Outbound open enrollment continues to grow, up 14% to 1,041 leavers in 2013 (281 inbound from other Districts).

- There is no mention of the local tax or economic base:
- The growth in Fund 80 (MSCR) property taxes and spending has been controversial over the years. Fund 80, up until recently was NOT subject to state imposed property tax growth limitations.
- Matthew DeFour briefly summarizes the partial budget information here. DeFour mentions (no source referenced or linked – in 2013?) that the total 2013-2014 budget will be $391,000,000. I don’t believe it:
The January, 2012 budget document mentioned “District spending remains largely flat at $369,394,753” (2012-2013), yet the “baseline” for 2013-2014 mentions planned spending of $392,807,993 “a decrease of $70,235 or (0.02%) less than the 2012-13 Revised Budget” (around $15k/student). The District’s budget generally increases throughout the school year, growing 6.3% from January, 2012 to April, 2013. Follow the District’s budget changes for the past year, here.
Finally, the document includes this brief paragraph:
Work will begin on the 2014-15 early this fall. The process will be zero-based, and every line item and FTE will be carefully reviewed to ensure that resources are being used efficiently. The budget development process will also include a review of benefit programs and procurement practices, among other areas.
One hopes that programs will indeed be reviewed and efforts focused on the most urgent issues, particularly the District’s disastrous reading scores.
Ironically, the recent “expert review” found that Analysis: Madison School District has resources to close achievement gap. If this is the case (and I agree with their conclusion – making changes will be extraordinarily difficult), what are students, taxpayers and citizens getting for the annual tax & spending growth?
I took a quick look at property taxes in Middleton and Madison on a $230,000 home. A Middleton home paid $4,648.16 in 2012 while a Madison home paid 16% more, or $5,408.38.

Madison Schools’ 2013-2014 Budget Charts, Documents, Links, Background & Missing Numbers
Sources:
- General and Categorical Aid – Payments to School Districts
- WISTAX Facts & Figures
- Madison Schools 2013-2014 June 10, 2013 Budget Discussion Document (PDF)
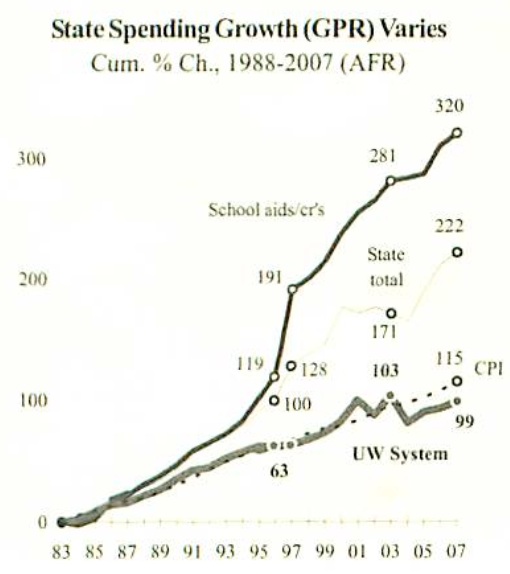
- Wisconsin State Tax Based K-12 Spending Growth Far Exceeds University Funding
- Up, Down & Transparency: Madison Schools Received $11.8M more in State Tax Dollars last year, Local District Forecasts a Possible Reduction of $8.7M this Year – March, 2013. The June 10, 2013 District budget document (PDF) fails to mention the previous year’s large increase in redistributed State of Wisconsin tax dollars:
Like all Wisconsin school districts, MMSD relies upon a state-local funding partnership. The actions of one partner greatly impact the other partner. The 2013-14 MMSD budget anticipates a major funding loss for MMSD (a loss of $8.7 in equalization aid) which shifts the funding burden onto the local property taxpayer.
The charts reveal several larger stories:
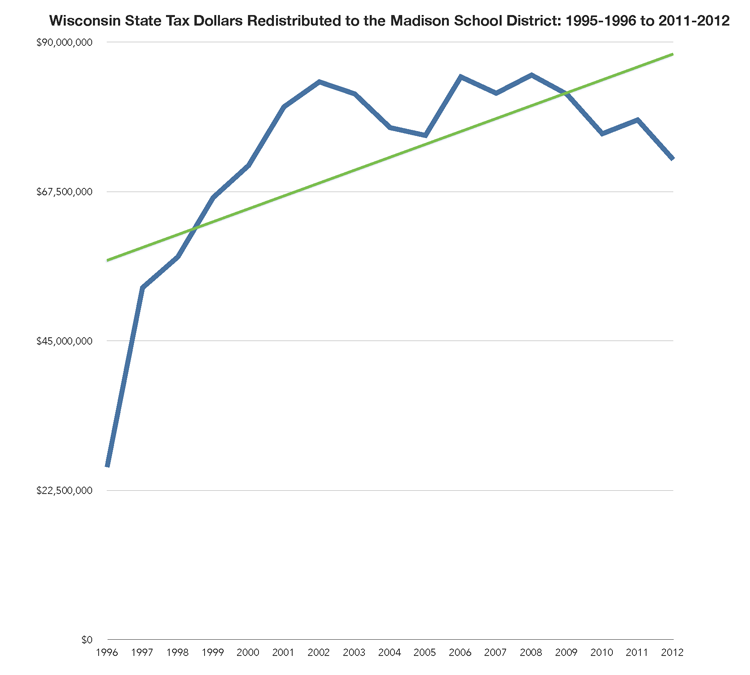
First, the State of Wisconsin “committed” to 2/3 K-12 funding in the mid-1990’s. The increase in redistributed state tax dollars is apparent. [Wisconsin Legislative Fiscal Bureau: State Aid to School Districts (PDF)]
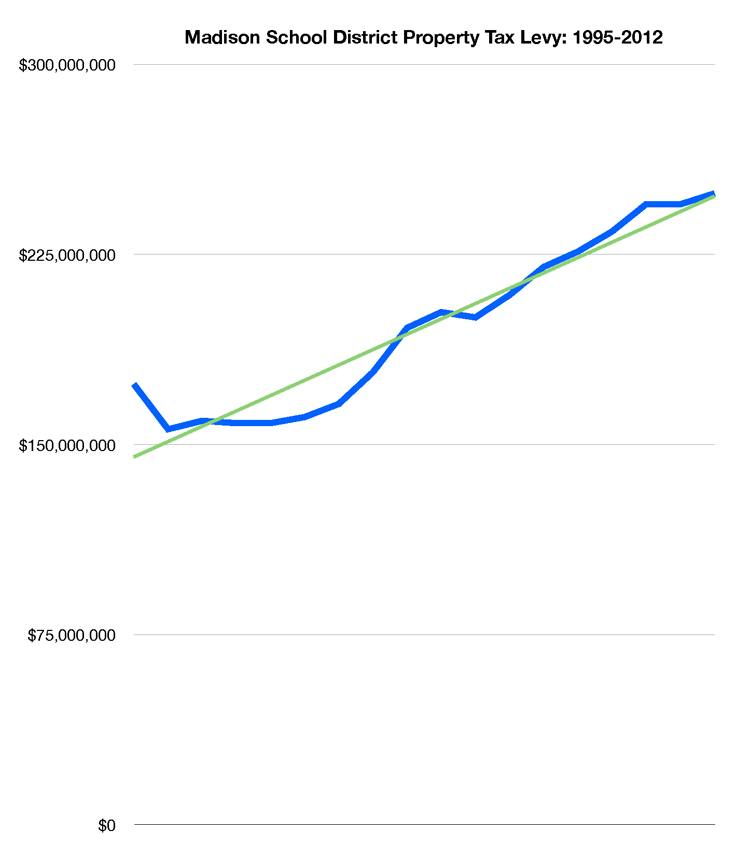
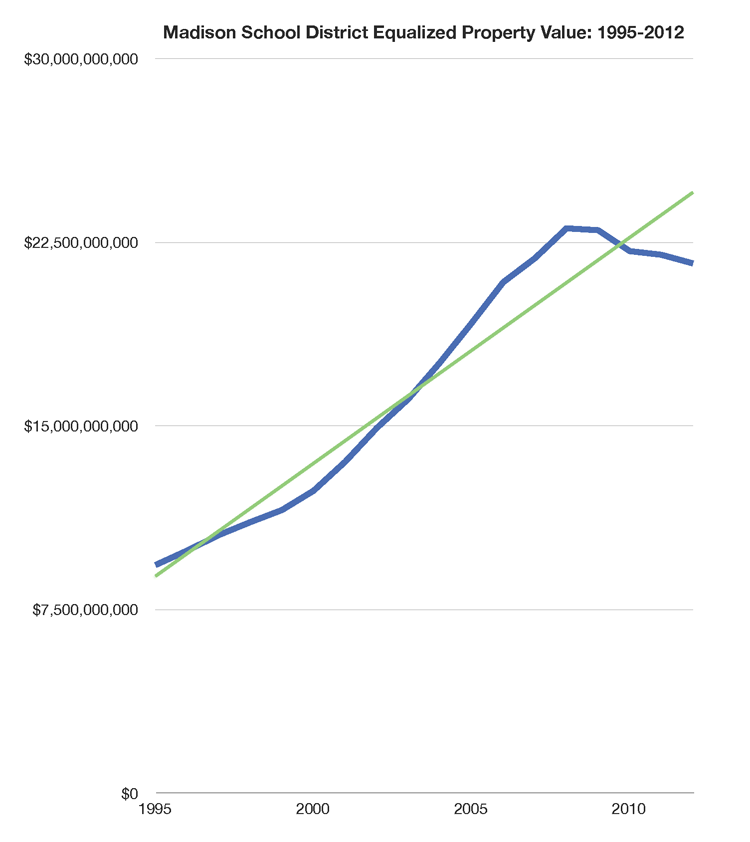
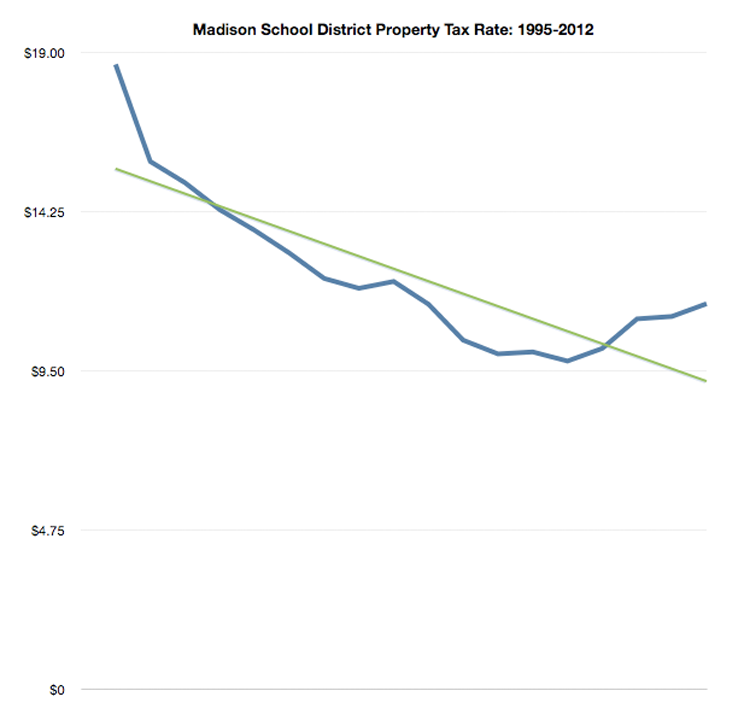
Second, Madison’s substantial real estate growth during the 2000’s supported growing K-12 spending while reducing the property tax rate (the overall pie grew so the “rate” could fall somewhat). The real estate music stopped in the late 2000’s (“Great Recession) and the tax rate began to grow again as the District consistently raised property taxes. *Note that there has been justifiable controversy over Madison’s large number of tax exempt properties. Fewer exemptions expands the tax base and (potentially) reduces individual homeowner’s taxes.
Third, Madison has long spent more per student than most public schools.
Fourth, the District’s June 10, 2013 budget document fails to address two core aspects of its mission: total spending and program effectiveness. The most recent 2012-2013 District budget number (via a Matthew DeFour email) is $392,789,303. This is up 4.4% from the July, 2012 District budget number: $376,200,000. The District’s budget has always – in my nine years of observation – increased throughout the school year. The late, lamented “citizen’s budget” was a short lived effort to create a standard method to track changes over time.
Fifth, the June 10, 2013 document does not include the District’s “Fund balance” or equity. The balance declined during the 2000’s, somewhat controversially, but it has since grown. A current number would be useful, particularly in light of Madison’s high property taxes.
Sixth, I took a quick look at property taxes in Middleton and Madison on a $230,000 home. A Middleton home paid $4,648.16 in 2012 while a Madison home paid 16% more, or $5,408.38. Local efforts to significantly increase property taxes may grow the gap with Middleton.
Finally, years of spending and tax growth have not addressed the District’s long term-disastrous reading results. Are we doing the same thing over and over?
Status Quo Costs More: Madison Schools’ Administration Floats a 7.38% Property Tax Increase; Dane County Incomes down 4.1%…. District Received $11.8M Redistributed State Tax Dollar Increase last year. Spending up 6.3% over the past 16 months
The Madison School District Administration (217 page 7.41MB PDF)
The Madison Metropolitan School District’s proposed 2013-2014 balanced budget provides resources for a sound education for the district’s children.
The proposed 2013-2014 balanced budget continues to put resources where they are most needed in the classrooms.
Total spending under the balanced budget is $392,807,993 which is a decrease of $70,235 or (0.02%) less than the 2012-13 Revised Budget. The change to the revenue limit plus other fund increases or decreases comprises the entire proposed budget. The property tax levy would increase by $18,385,847 or 7.38% to $267,675,929.
The total MMSD 2013-14 balanced budget includes many funds. A fund is a separate set of accounting records, segregated for the purpose of carrying on specific activities. A fund is established for accountability purposes to demonstrate that financial resources are being used only for permitted purposes. The Wisconsin Department of Public Instruction specifies the various funds required to be used by Wisconsin school districts.A few useful links:
The January, 2012 budget document mentioned “District spending remains largely flat at $369,394,753” (2012-2013), yet the “baseline” for 2013-2014 mentions planned spending of $392,807,993 “a decrease of $70,235 or (0.02%) less than the 2012-13 Revised Budget” (around $15k/student). The District’s budget generally increases throughout the school year, growing 6.3% from January, 2012 to April, 2013. Follow the District’s budget changes for the past year, here.
Meanwhile, via a kind reader, Wages for Dane County and Wisconsin workers fell, latest federal figures sayThe average weekly wage for workers in Dane County fell by 4.1 percent between September 2011 and September 2012, the first decrease for the third quarter in at least a decade and a touch greater than the state average, according to newly released data from the U.S. Bureau of Labor Statistics.
Dane County workers made an average of $842 weekly in the third quarter of 2012, down $36 from the same time period a year earlier. It was the 12th-biggest drop in terms of percentage among Wisconsin’s counties.
Statewide, wages fell 2.65 percent to an average of $770 per week. That was the fourth-biggest loss among states by percentage. Nationally, Wisconsin ranked 35th among the states for wages, down from 33rd for the third quarter in 2011.
The data also show that Wisconsin ranked 44th nationwide in job creation for the private sector, but while job creation has dominated news coverage here owing largely to Gov. Scott Walker’s pledge to create 250,000 new jobs during his term, stagnant wages have been a longstanding concern.Finally, should Madison, Wisconsin and federal taxpayers spend more for ongoing disastrous reading results?
The defunct “citizen’s budget” was an effort to create an easily comparable annual two page document, rather than the present 217 pager.
“Censorship through complexity” – Assange
Madison Urban League’s 2013-2014 Strategic Plan
1.7MB PDF via a kind Kaleem Caire email:
Between January 1, 2011 and December 31, 2012, the Urban League of Greater Madison stood on the firm shoulders of its founders – Leslie Fishel, Jr., Sydney Forbes, Isobel Clark and Frank Morrison – and demonstrated exceptional courage and foresight by launching a well-orchestrated campaign to raise the community’s consciousness about an embarrassing and unconscionable racial achievement gap that is leaving hundreds of Black, Latino and Asian children behind each year. We also informed the community about the acceleration of middle class families moving their children out of Madison’s public schools, either through relocation or utilizing the state’s inter-district public school choice program. Between 1989 and 2012, the student population in Madison schools grew from 24% non-white to 55% non-white. We also began an aggressive campaign to enlist the support of businesses, education institutions, community partners and resource providers to expand workforce development and career training opportunities for unemployed and underemployed adults in Dane County, and address diversity and inclusion opportunities among them.
The public should consider our 2013-14 Strategic Plan to be Phase II of the League’s efforts to provide courageous and transformational leadership to ensure thousands more children, adults and families succeed in our schools, colleges, workplaces, neighborhoods and communities. In 2020, the Urban League of Greater Madison would like local citizens and the national media to report that Madison, Wisconsin has indeed become “Best [place] in the Midwest for Everyone to Live, Learn and Work”. Early returns on the investment made thus far indicate that our vision can become a reality.
This Strategic Plan covers a 24-month period, from January 1, 2013 through December 31, 2014. We believe shorter time-windows enable us to keep the organization focused on achieving a reasonable number of high impact goals, and with the appropriate sense of urgency necessary to produce the results it seeks and the community needs. As our nation has demonstrated extraordinary courage and overcome extraordinary challenges in years past, we will do so again.The Urban League’s Board of Directors is interesting in its breadth. Mo Andrews, architect of WEAC’s rise is an interesting member.
Wisconsin Elementary Teacher Content Knowledge Exam Results (First Time Takers)
Foundations of Reading Test (Wisconsin) Result Summary (First Time Takers): May 2013 – August 2014 (Test didn’t start until January 2014, and it was the lower cut score): 2150 pass out of 2766 first time takers = 78% passage rate .xls file September 2014 – August 2015 (higher cut score took effect 9/14): 2173/3278 = […]
Deja Vu: Madison School District Agreement with the US ED Office of Civil Rights
Last October, Madison Superintendent Jen Cheatham signed a resolution agreement with the U.S. Department of Education’s Office for Civil Rights regarding OCR’s compliance review of access to advanced coursework by Hispanic and African-American students in the District. The resolution agreement was presented at the December 5, 2016 Instruction Workgroup meeting (agenda item 6.1): http://www.boarddocs.com/wi/mmsd/Board.nsf/goto?open&id=AFL2QH731563 The […]
Undermining Pell
Stephen Burd: In the new report released today, “Undermining Pell III: The News Keeps Getting Worse for Low-Income Students,” Stephen Burd, Senior Policy Analyst with New America’s Education Policy Program, examines U.S. Department of Education data showing the average net price that students from low-income families attending 1,400 four-year public and private colleges paid in […]
School District Financial Condition and Achievement Postcard….
The Beaver Dam, Wisconsin School District embraces direct mail with a glossy postcard: Tap for a larger version. It appears that the District is preparing for the financing and construction of a new high school facility. The website is attractive and information discovery is not too bad. That said, Beaver Dam, like Madison, could make […]
Madison Schools’ Outbound Open Enrollment Continues to Grow; 2015-2016 Budget is $454,414,941.93
Madison Government School District “Final” 2015-2016 Budget (5.2MB PDF): Page 39: 2013-2014 Total Spending: $408,806,234.75 2014-2015: $411,671,817.67 2015-2016: $454,414,941.93 or $16,724.26 per student (27,171 students) The United States spends $12,401 per student nationally, about 34% less than Madison. Much more on open enrollment, here.
Ranking the top open admission New Jersey high schools by SAT scores
Colleen O’Dea: Today’s vo-techs now operate some of the most elite public schools in New Jersey and the nation. U.S. News and World Report ranked Biotechnology High School in Freehold, part of the Monmouth County Vocational School District, 11th best in the nation and best in New Jersey among public schools. High Technology High School […]
Madison School District’s 2015-2016 Budget Goals & Priorities (Publish Total Spending?)
Madison School District (PDF): A. Alignment to Strategic Framework- In our vision to make every school a thriving school that prepares every student to be ready for college, career and community, these budget resources support the district’s goals and priorities as defined in our Strategic Framework. B. More equitable use of resources- As opposed to […]
‘We have to do better’ – Trenton school officials seek reversal of low test scores
Jenna Pizzi: For students from third to eighth grades, achievement has remained stagnant over the last five years. Last school year, the district had 26.9 percent of third graders ranked as proficient or above in language arts. That proficiency stayed in the low 20 percent range for grades four through seven. In eighth grade, 42.2 […]
Despite proven academic success of NYC’s charter schools, the mayor and unions are waging a war on city’s charter kids
Mark Perry: The profiles of four Harlem charter schools, operated by Success Academy Charter Schools are displayed above, based on new 2014 data from the SchoolDigger website and national school database. All four Harlem Success Academy charters serve primarily minority student populations (all are 93.5 to 97.1% black and Hispanic) and low-income households (75 to […]
How Private Colleges Are Like Cheap Sushi
Anya Kamenskoye etz: In New York City’s East Village, there are a number of hole-in-the-wall spots that advertise sushi at 50 percent off. But I can never bring myself to sample the goods. We’re talking about a delicacy flown in from around the world. Marking it down drastically just doesn’t sit right. Something — either […]
Commentary on Madison’s Achievement Gap
The Capital Times: The statistics on African-American achievement have been so grim throughout the years that in 2010, Kaleem Caire, at the time the CEO of the Urban League of Greater Madison, put forth a proposal for a charter school designed to help African-American students surmount the achievement gap. It was ultimately rejected by the […]
Proposed changes to storied IB program roil Denver high school
Alan Gottlieb & Kate Schimel: When the Saturday morning meeting about proposed changes to George Washington High School’s International Baccalaureate program got off to a raucous, even unruly start in the school library, a mixed group of IB and non-IB students decided to take matters into their own hands. As angry parents who had expected […]
Madison Schools’ 2014-2015 $402,464,374 Budget Document (April, 2014 version)
The Madison School District (3MB PDF): Five Priority Areas (just like the “Big 10”) but who is counting! – page 6: – Common Core – Behavior Education Plan – Recruitment and hiring – New educator induction – Educator Effectiveness – Student, parent and staff surveys – Technology plan 2014-2015 “budget package” 3MB PDF features some […]
Choice, Not More Spending, Is Key To Better Schools; Wisconsin 12th in Spending, 24th in Achievement
W. Michael Cox & Richard Alm Education looms as both cause and cure for the decline of the middle class and the widening gap between rich and poor. In today’s knowledge-based economy, poorly performing public schools leave many U.S. workers ill-equipped for jobs that pay middle-class wages. So it follows that improving education is the […]
Elementary Data: Madison’s Proposed $39,500,000 Maintenance & Expansion Referendum
Madison Schools’ March, 2014 Facility Plan (PDF):: Shorewood Elementary: In conjunction with building an elevator tower, add a four-classroom addition. The additional classrooms are a relatively easy gain based on the building design. Shorewood’s 2013-2014 Low Income Population: 33.8%; All Madison Elementary Schools: 52.1% 2012-2013 Basic & Minimal Reading Proficiency: 34.3% Madison School District: 62.5% […]
Current Madison Elementary School Boundaries…. & the School Board Election
Two Madison School Board candidates recently expressed opposition to boundary changes: Flores also said when students and parents walk to their schools, it fosters family connections and relationships between families and school faculty. “If (any) boundary changes obstruct from that, then I’m against that,” said Flores, who also said he supports asking voters for money […]
Shaking Up the Classroom Some Schools Scrap Age-Based Grade Levels, Focusing on Mastery of Material
Stephanie Banchero: There are no seventh-graders in the Lindsay Unified School District. Instead, in the “Content Level 7″ room at Washington Elementary, 10 students, ages 11 to 14, gather around teacher Nelly Lopez for help in writing essays. Eight sit at computers, plowing through a lesson on sentence structure, while a dozen advanced students work on […]
Madison Schools’ attendance area changes hard — but probably worth it
One advantage to redrawing the lines is that it could delay the financial hit of having to build a new school. Some school officials are already talking referendum. Plus, with space available in the district, is there really any good reason any student should be forced to attend class in what was formerly a closet, as some at Sandburg Elementary do?
More troubling is the effect crowding could have on low-income students who, statistically at least, struggle academically and might benefit from better learning environments.
According to data collected by the Department of Public Instruction, 48.9 percent of Madison elementary students were considered “economically disadvantaged” last school year. For the five schools over capacity now, that percentage was 48.4.
But two of those schools are more affluent and are expected to see their enrollments drop below 100 percent capacity by 2018-19. Most of the seven schools expected to be over capacity in 2018-19 serve less affluent areas of Madison, and collectively, the seven had a student population that was 57.8 percent economically disadvantaged last year.
The Myth of “Public” Schools
This disturbing article about a rich neighborhood of Baton Rouge, La., that wants to secede so it won’t have to share school funding with poorer neighborhoods reminds me of one of my great frustrations with the K-12 education policy debate–the terminology of “public schools.”
The way the word is used a school is “public” if it is owned by a government entity and thus part of the public sector. But a public school is by no means a school that’s open to the public in the sense that anyone can go there. Here in the District of Columbia anyone who wants to wander into a public park is free to do so (that’s what makes it public) but to send your kid to a good “public” elementary school in Ward 3 you have to live there. And thanks to exclusionary zoning, in practice if you want to live in Ward 3 you have to be rich. It wouldn’t be legal to respond to the very high price of land in the area by building homes on small lots, or building tall buildings full of small affordable apartments.
Since D.C. doesn’t have Louisiana’s political culture, Ward 3 generally doesn’t have a problem with its tax dollars subsidizing the schools in Wards 5, 7, and 8, but if you proposed randomly assigning students to schools to produce integrated instructional environments, you’d have an epic battle on your hands.
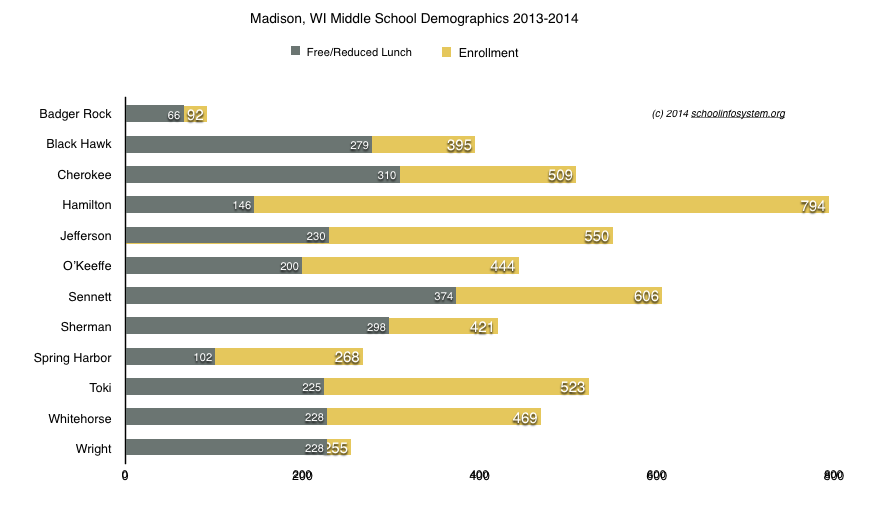
Madison has long supported a wide variation in school demographics. The chart above, created from 2013-2014 Madison School District middle school demographic data, illustrates the present reality, with the largest middle school – near west side Hamilton – also featuring the smallest percentage low income population.
A somewhat connected (one end of the class spectrum) view of the State of Madison’s $395M Public School District
Today, Caire’s tone has moderated. Somewhat.
“Teachers are not to blame for the problems kids bring into the classroom,” he says. “But teachers have to teach the kids in front of them. And Madison teachers are not prepared to do that. Now we have two choices: Make excuses why these kids can’t make it and just know that they won’t. Or move beyond and see a brighter future for kids.”
Many parents back him up. And many parents of students of color say that their experience with Madison’s public schools–both as students here, themselves, and now as parents–is simply much different and much worse than what they see white students and parents experiencing.
“I just always felt like I was on as a parent, like every time I walked through the door of that school I would have to go to bat for my son,” says Sabrina Madison, mother of a West High graduate who is now a freshman at UW-Milwaukee. “Do you know how many times I was asked if I wanted to apply for this [assistance] program or that program? I would always say, ‘No, we’re good.’ And at the same time, there is not the same ACT prep or things like that for my child. I was never asked ‘Is your son prepared for college?’ I never had that conversation with his guidance counselor.”
Hedi Rudd, whose two daughters graduated from East and son from West, says it has been her experience that the schools are informally segregated by assistance programs and that students of color are more likely to be treated with disrespect by school personnel. “Walk into the cafeteria and you’ll see the kids [of color] getting free food and the white students eating in the hall. I walked into the school office one day,” she recalls. “I look young and the secretary thought I was a student. She yelled, ‘What are you doing here?’ I just looked at her and said, ‘Do you talk to your students like that?'”
Dawn Crim, the mother of a daughter in elementary school and a son in middle school, says lowered expectations for students of color regardless of family income is an ongoing problem. “When we moved to Madison in 1996, we heard that MMSD was a great school district … and for the most part it has been good for our kids and family: strong teachers, good administrators, a supportive learning environment, and we’ve been able to be very involved.”
But?
“Regarding lower expectations for kids of color, not just disadvantaged kids, we, too, have experienced the lower expectations for our kids; overall there is a feeling and a sense of lower expectations,” Crim says. “And that should not come into play. All of our kids should be respected, pushed, have high expectations and should get the best education this district says it gives.”
In the meantime, the school district has been running programs in partnership with the Urban League of Greater Madison, UW-Madison, United Way of Dane County, the Boys and Girls Club of Dane County, and other organizations–all designed to lift scholastic achievement, close the gap, and get more kids graduated and on to college.
The Advancement Via Individual Determination program known as AVID (or AVID/TOPS, when coordinated with the Teens Of Promise program) is run by the district and the Boys and Girls Club here, and is a standout in a slew of public/private efforts to change the fate of students of color in Madison.
…..
At the end of the last school year, a total of four hundred forty-two students did not graduate on time from high school in Madison. One hundred nine were white, eighty-six were Hispanic, thirty-three were Asian and one hundred ninety-one were African American. If the graduation rate for African American students had been comparable to the eighty-eight percent graduation rate of white students, one hundred forty more African American students would have graduated from Madison high schools.
But they did not. While it’s true that the district actively searches out students who did not graduate on time, and works with them so that as many as possible do ultimately graduate, the black-and-white dividing line of fifty-five/eighty-eight remains for now the achievement gap’s stark, frightening, final face. What can be said is that many more Madisonians are paying attention to it, and many people in a position to make a difference are doing their level best to do something about it.
……
“One of the reasons we haven’t been as successful as we could be is because we’ve lacked focus and jumped from initiative to initiative,” she (Cheatham) says of the Madison schools.Related: notes and links on Mary Erpanbach, Jennifer Cheatham and Madison’s long term disastrous reading scores.
Background articles:
Notes and links on the rejected Madison Preparatory IB Charter School.
When all third graders read at grade level or beyond by the end of the year, the achievement gap will be closed…and not before (2005).
Notes and Links on the Madison K-12 Climate and Superintendent Hires Since 1992.
My Life and Times With the Madison Public Schools
Latest Madison Schools’ 2013-2014 $391,834,829 Budget.
Madison Schools’ 2014-2015 Budget Forecast 1; “Same Service” or “Cost to Continue”; “intends to go beyond marginal refinements”.
Madison School District (PDF):This budget forecast and those that will follow are intended to keep the board informed as the budget development process unfolds. The forecasts also provide an opportunity for board discussion and input into important budget development issues.
MMSD’s Strategic Framework establishes the direction of the school district. The framework is supported by the annual budget, which is simply the resource strategy behind the Strategic Framework. The budget process begins with a thorough review of district priorities, current spending patterns, and outcomes. The zero- based budget process requires a critical examination of all budget practices and how those practices influence resource deployment.
Based upon our budget work thus far, we believe there are opportunities to make the staffing process more responsive to individual school needs, to shift non- personnel resources from central office budgets to school budgets, and to improve budget accuracy by clarifying and simplifying account structures. We’re excited to explore these and other opportunities throughout the 2014-15 budget process.
Zero-based Approach to Budget Development:
A zero-based approach is being used to develop the expenditure budget. Unlike an ‘historical cost’ budget or a ‘cost to continue’ budget, the zero-based process is intended to go beyond marginal refinements of existing budgets and existing structures.
For example, MMSD has used essentially the same staffing allocation process for over ten years under the ‘cost to continue’ approach, with only minor modifications along the way. While the existing allocation process is uniform and consistent, it can be improved by making it more responsive to the challenges presented by individual schools. The senior leadership team, with input from the principals, is assessing the staffing allocation process this month before any allocation decisions are put into motion in February.
The existing staff allocation process consists of a series of departmental layers, with separate staffing allocations for regular education, special education, Title 1, OMGE, pupil services, PBS, etc. We are hopeful that a more integrated and responsive staffing allocation process, beginning this year and refined continuously in subsequent years, will produce a more tailored fit for each school. The zero-based approach is designed to uncover such opportunities.
The zero-based process also includes in-depth reviews of each central office department. We are particularly interested in identifying inter-departmental overlaps, gaps, and even redundancies. We are optimistic that this effort will produce new efficiencies and help push resources from the district office into the schools.
Strategic Priorities Drive the Budget:
The resource decisions contained in the annual budget are subject to continuous review, either directly through the zero-based budget process, or indirectly through the SIP process, district surveys, targeted studies (such as the Principal Pipeline study [PDF] and High School Reform study), and several active advisory committees. These are the sources which inform the budget development process.
The Strategic Framework identifies five key priorities which are aimed at providing schools with the tools, processes and resources they need to serve children and their families better than ever before. The five priorities are: (1) Coherent Instruction, (2) Personalized Pathways, (3) Family and Community Engagement, (4) A Thriving Workforce, and (5) Accountability at All Levels.
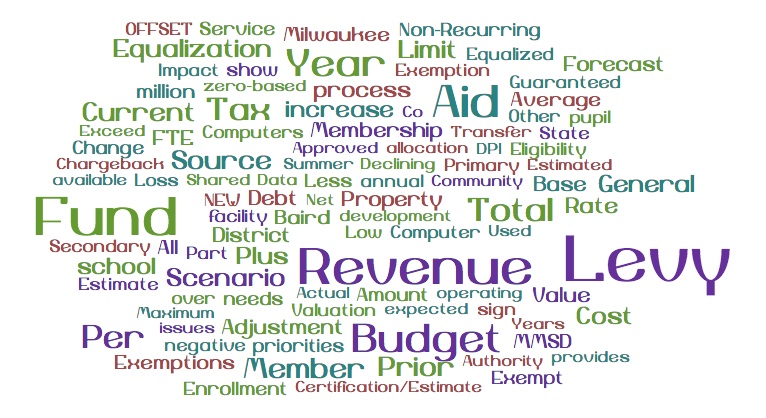
Each of the priorities in the Strategic Framework includes a set of high-leverage actions that have cost implications. A preview of some of the major actions with cost implications, organized by Priority Area, will be developed and refined throughout the budget development process. A preview of the major actions will be presented to the Operations Work Group along with this Budget Forecast.The word cloud is interesting, particularly in light of the District’s job number one, addressing its long term disastrous reading results.
Related: numerous links on the District’s 2013-2014 budget, here. Madison spends about twice the national average per student ($15k).
Scarsdale Elementary School Program Review
The Principals of the five elementary schools and Scarsdale Assistant Superintendent Lynne Shain took center stage at the Board of Education meeting on Monday night December 9 to present a review of the elementary school program in the district. This presentation is one of a series of special reports that have been presented at Board of Education meetings in preparation for school budget discussions for 2014-15. The Principals reviewed the curriculum, program elements and staffing to give an overview of activities at the five schools, explain what’s now being done and the associated costs.
It was an impressive review of many of the elements of the elementary program and it can be viewed on the Scarsdale Schools website on the Video on Demand page here or read the highlights of the presentations below.
Shain explained that the highly professional staff, small class sizes, student support, emphasis on basic skills plus interdisciplinary programs and critical and creative problem solving all contribute to a successful K-8 program that allows students to excel in high school and beyond. In response to new federal and state requirements to teach the core curriculum the district has made modest modifications to the curriculum where needed.Much more on Scarsdale, here.
Scarsdale plans to spend $143,899,713 during the 2013-2014 school year for 4,700 students or $30,616 (!) per student. This is about double Madison’s $15K/student, which is itself, double the United States average. Scarsdale demographics & Madison.
Vermont Report: Shaping the Soul of a School
I found Principal Brian Williams in the lunchroom of the Sustainability Academy, a pre-K – 5 magnet school in the Old North End of Burlington, Vermont. He was easy to spot, the biggest guy in the room, sitting on a very small chair, talking with an 8-year-old tousled-haired boy who was having trouble with his writing. It was noontime, and Principal Williams asked me if I would like some of today’s lunch: “Beef stew. I made it myself.”
I was about to chuckle a “Sure, sure” when I stopped and thought that actually, maybe he had made the stew himself. It seemed like such a place where the principal might also be the cook.
Just 5 years ago, the Sustainability Academy (SA) was known as the Lawrence Barnes Elementary School, one of two failing schools (the other was H.O. Wheeler) in the needy, sketchy part of Burlington, where about 95% of the kids were on free or reduced lunch (the nation’s most reliable proxy for poverty), test scores were very low and enrollment was declining. The school’s neighborhood is home to a mix of the down-and-out, the frontier-pushers, and is also the first stop for many of Burlington’s constant influx of refugees and immigrants.The Burlington, VT school district will spend $59,615,950 to education about 3,600 students during the 2013-2014 school year, or $16,559.98 per student. Madison will spend about $15k/student this year, about twice the national average.
Comments & Links on Madison’s Latest Teacher Union Agreement
Under the new contracts clerical and technical employees will be able to work 40-hour work weeks compared to the current 38.75, and based on the recommendation of principals, employees who serve on school-based leadership teams will be paid $20 per hour.
Additionally, six joint committees will be created to give employees a say in workplace issues and address topics such as planning time, professional collaboration and the design of parent-teacher conferences.
Kerry Motoviloff, a district instructional resource teacher and MTI member, spoke at the beginning of the meeting thanking School Board members for their collective bargaining and work in creating the committees that are “getting the right people at the right table to do the right work.”
Cheatham described the negotiations with the union as “both respectful and enormously productive,” adding that based on conversations with district employees the contract negotiations “accomplished the goal they set out to accomplish.”“Madison is in the minority. Very few teachers are still under contract,” said Christina Brey, spokeswoman for the Wisconsin Education Association Council. Fewer than 10 of 424 school districts in the state have labor contracts with teachers for the current school year, she said Wednesday.
And while Brey said WEAC’s significance is not undermined by the slashed number of teacher contracts, at least one state legislator believes the state teacher’s union is much less effective as a resource than it once was.
Many school districts in the state extended teacher contracts through the 2011-2012 school year after Act 10, Gov. Scott Walker’s law gutting collective bargaining powers of most public employees, was implemented in 2011. The Madison Metropolitan School District extended its teacher contract for two years — through the 2013-2014 school year — after Dane County Judge Juan Colas struck down key provisions of Act 10 in September 2012.
The contract ratified by the members Monday will be in effect until June 30, 2015.On Thursday, the Wisconsin Institute for Law and Liberty emailed a letter to Cheatham and the School Board warning that a contract extension could be in violation of Act 10.
Richard Esenberg, WILL president, said he sent the letter because “we think there are people who believe, in Wisconsin, that there is somehow a window of opportunity to pass collective bargaining agreements in violation of Act 10, and we don’t think that.”
If the Supreme Court rules Act 10 is constitutional all contracts signed will be in violation of the law, according to Esenberg.
Esenberg said he has not read the contract and does not know if the district and union contracts have violated collective bargaining agreements. But, he said, “I suspect this agreement does.”The contract does not “take back” any benefits, Matthews says. However, it calls for a comprehensive analysis of benefits that could include a provision to require employees to pay some or more toward health insurance premiums if they do not get health care check-ups or participate in a wellness program.
Ed Hughes, president of the Madison School Board, said that entering into labor contracts while the legal issues surrounding Act 10 play out in the courts was “the responsible thing to do. It provides some stability to do the important work we need to do in terms of getting better results for our students.”
Hughes pointed out that the contract establishes a half-dozen joint committees of union and school district representatives that will take up issues including teacher evaluations, planning time and assignments. The contract calls for mediation on several of the issues if the joint committees cannot reach agreement.
“Hopefully this will be a precursor of the way we will work together in years to come, whatever the legal framework is,” Hughes said.
Matthews, too, was positive about the potential of the joint committees.Wisconsin Institute for Law & Liberty:
WILL President and General Counsel Rick Esenberg warns, “The Madison School Board is entering a legally-gray area. Judge Colas’ decision has no effect on anyone outside of the parties involved. The Madison School Board and Superintendent Cheatham – in addition to the many teachers in the district – were not parties to the lawsuit. As we have continued to say, circuit court cases have no precedential value, and Judge Colas never ordered anyone to do anything.”
He continued, “If the Madison School District were to collectively bargain in a way that violates Act 10, it could be exposed to litigation by taxpayers or teachers who do not wish to be bound to an illegal contract or to be forced to contribute to an organization that they do not support.” The risk is not theoretical. Last spring, WILL filed a lawsuit against the Milwaukee Area Technical College alleging such a violation.The Wisconsin Institute for Law & Liberty’s letter to Madison Superintendent Jennifer Cheatham (PDF).
The essential question, how does Madison’s non-diverse K-12 governance model perform academically? Presumably, student achievement is job one for our $15k/student district.
Worth a re-read: Then Ripon Superintendent Richard Zimman’s 2009 speech to the Madison Rotary Club:“Beware of legacy practices (most of what we do every day is the maintenance of the status quo), @12:40 minutes into the talk – the very public institutions intended for student learning has become focused instead on adult employment. I say that as an employee. Adult practices and attitudes have become embedded in organizational culture governed by strict regulations and union contracts that dictate most of what occurs inside schools today. Any impetus to change direction or structure is met with swift and stiff resistance. It’s as if we are stuck in a time warp keeping a 19th century school model on life support in an attempt to meet 21st century demands.” Zimman went on to discuss the Wisconsin DPI’s vigorous enforcement of teacher licensing practices and provided some unfortunate math & science teacher examples (including the “impossibility” of meeting the demand for such teachers (about 14 minutes)). He further cited exploding teacher salary, benefit and retiree costs eating instructional dollars (“Similar to GM”; “worry” about the children given this situation).
Wisconsin school spending grew 10.2% during 2008-11, compared to 2.9% nationally, according to newly available Census figures
Despite cuts to state school aid in 2010, and slower growth of school revenue limits in 2010 and 2011, Wisconsin per student spending increased 2.6% in 2010 and 3.6% in 2011. Wisconsin school spending averaged $11,774 per student in 2011, 15th highest nationally and 11.5% above the national average ($10,560).
What is not yet known (since federal data have a two year lag) is how Wisconsin will stack up with other states in light of state budget actions in 2011-13. However, researchers from the Wisconsin Taxpayers Alliance (WISTAX) estimate that the 5.5% cut in 2012 Wisconsin school revenue limits will trim spending to $11,126 per student, potentially shrinking the gap between school spending here and nationally. WISTAX is a nonpartisan, nonprofit research organization dedicated to policy research and citizen education.
The new federal figures for 2011 show that, unlike Wisconsin, many states saw declining combined aid (state and federal) to schools during 2009-11; 11 states in 2009, 17 in 2010, and 22 in 2011. By contrast, state-federal support in Wisconsin rose 3.3% in 2009, 0.4% in 2010, and 2.7% in 2011.
The difference in aid trends between Wisconsin and the nation was reflected in per pupil expenditures. U.S. school spending grew 2.3% in 2009 and 1.1% in 2010, before falling 0.5% in 2011. In Wisconsin, however, per student spending during those years rose 3.7%, 2.6%, and 3.6%, respectively.
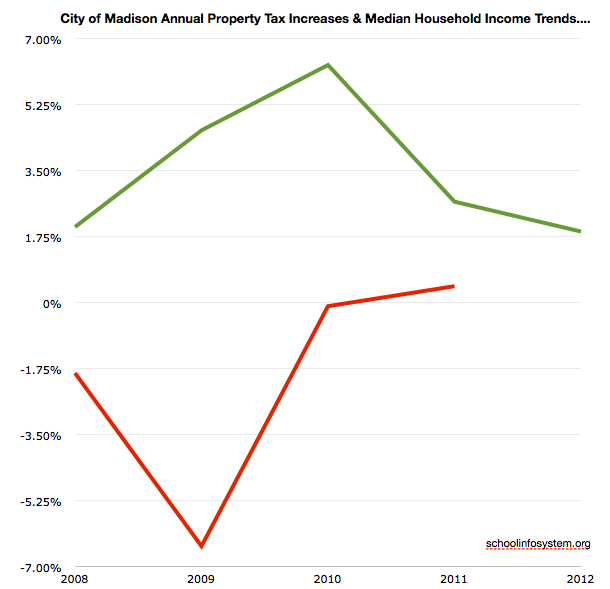
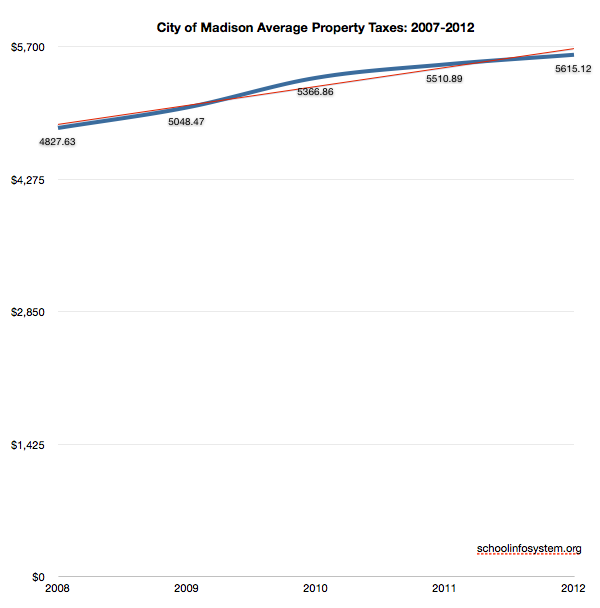
Many states trimmed school spending during 2009-11. Two states made cuts in all three years, and another seven cut spending in both 2010 and 2011. As national figures have already suggested, retrenchment did not occur in Wisconsin until 2012.Related: A Look at Property Taxes Around the World and Madison’s 16% increase since 2007; Median Household Income Down 7.6%; Middleton’s 16% less and Madison School Board Passes 2013-2014 Budget, including a 4.5% Property Tax Increase.
K-12 Governance Post Act 10: Kenosha teachers union is decertified; Madison Appears to Continue the Status Quo
The union representing Kenosha teachers has been decertified and may not bargain base wages with the district.
Because unions are limited in what they can do even if they are certified, the new status of Kenosha’s teachers union — just like the decertification of many other teachers unions in the state that did not or could not pursue the steps necessary to maintain certification in the new era of Act 10 — may be a moral blow more than anything else.
Teachers in Milwaukee and Janesville met the state’s Aug. 30 deadline to apply for recertification, a state agency representative says. Peter Davis, general counsel for the Wisconsin Employment Relations Commission, said the Milwaukee and Janesville districts will hold recertification votes in November.
To continue as the recognized bargaining unit in the district, 51% of the union’s eligible membership must vote in favor of recertification, according to the controversial Act 10 legislation passed in 2011.
With contracts that were in place through the end of June, teachers in the three large southeastern Wisconsin districts were protected the longest from the new legislation, which limits collective bargaining, requires unions to hold annual votes to be recognized as official entities, and mandates that teachers and other public employees pay more out-of-pocket for their health care and retirement costs.
…..
“It seems like the majority of our affiliates in the state aren’t seeking recertification, so I don’t think the KEA is an outlier or unique in this,” Brey said.
She added that certification gives the union scant power over a limited number of issues they’d like a voice in.
Sheronda Glass, the director of business services in Kenosha, said it’s a new experience for the district to be under Act 10.Contrary to some published media reports, however, the union did not vote to decertify.
In fact, no such election was ever held, according to KEA Executive Director Joe Kiriaki, who responded to a report from the Conservative Badger blog, which published an article by Milwaukee radio talk show host Mark Belling, who said he had learned that just 37 percent of the teachers had voted to reauthorize the union.
In a prepared statement, Kiriaki criticized the district for “promoting untrue information” to Belling.
Union chose to focus on other issues
Kiriaki said the union opted not to “jump through the hoops,” such as the recertification requirement, created by Act 10, the state’s relatively new law on collective bargaining.
The law, among other things required the annual re-certification of unions if they want to serve as bargaining representatives for teachers and other public workers. It also prohibits most public employees from negotiating all but base wages, limiting them to the rate of inflation.
Kiriaki cited a ruling by a Dane County Circuit Court judge on the constitutionality of Act 10, saying he believed it would be upheld.Interestingly, Madison School District & Madison Teachers to Commence Bargaining. Far more important, in my view is addressing Madison’s long standing, disastrous reading results.
In my view, the unions that wish to serve their membership effectively going forward would be much better off addressing new opportunities, including charters, virtual, and dual enrollment services. The Minneapolis Teachers Union can authorize charters, for example.
Much more on Act 10, here.
A conversation with retired WEAC executive Director Morris Andrews.
The Frederick Taylor inspired, agrarian K-12 model is changing, albeit at a glacial pace. Madison lags in many areas, from advanced opportunities to governance diversity, dual enrollment and online opportunities. Yet we spend double the national average per student, funded by ongoing property tax increases.
An elected official recently remarked to me that “it’s as if Madison schools have been stuck in a bubble for the past 40 years”.
The Federal Pell Grant Program: Recent Growth and Policy Options
Summary The Federal Pell Grant Program was created to improve the access of low-income students to postsecondary edu- cation. Grant recipients enroll at a variety of educational institutions, including four-year colleges and universities, for-profit schools, two-year community colleges, and institutions that specialize in occupational training. Grants are awarded on the basis of financial need and aca- demic course load, and the maximum grant a student can receive for the 2013-2014 award year is $5,645. During the most recent award year for which data are available (July 1, 2011, to June 30, 2012), the program provided $33.6 billion in grants to some 9.4 million students at U.S. educational institutions. The cost of the program has risen dramatically in recent years.
From 2006-2007 to 2010-2011, real (inflation-adjusted) spending on Pell grants increased by 158 percent. That change resulted from an 80 percent rise in the number of recipients and a 43 percent real increase in the amount of the average grant during those four years (see Figure 1). Spending for the program declined in 2011-2012 because of a reduction in the amount of the average grant.
Union leader: Pay boost for Madison educational assistants is ‘step in the right direction’
The Madison School Board is taking a “step in the right direction” in acknowledging the role of educational assistants in helping students succeed, says a union leader.
The 737 educational assistants in the district had been working without a pay raise since 2009 says Erin Proctor, president of their Madison Teachers Inc. collective bargaining unit.
The $433.6 million budget for the 2013-2014 school year approved Monday also includes a 1 percent salary hike for teachers and administrators. The budget will translate to a 4.47 percent increase in the property tax levy.
The pay increase will boost the starting base wage for educational assistants to $12.58 an hour which, with longevity increases, can rise to more than $20 an hour for some work assignments, according to the labor contract. But educational assistants typically don’t get as many work hours as most full-time workers do, Proctor says.Much more on the Madison Schools’ 2013-2014 budget, here.
Fairfax County School Board often has millions in extra cash to spend;
Although the Fairfax County School Board faces projected budget deficits and each year asks the Board of Supervisors for more taxpayer money to fund its regular operations, it also has found a creative way to pay for projects and add items to classrooms: a fund filled with millions in leftover cash.
Fairfax’s school system has ended each budget year with an average of $30 million in unspent funds from the system’s budget during the past decade, a budget that topped out at $2.5 billion this past year. The leftover cash, ranging from $4 million to $55 million, is usually generated from savings — such as heating bills that are lower than projected during a mild winter — or from unforeseen revenue increases, including income that was higher than expected from county sales taxes.
The leftover money accounts for about 1 to 2 percent of the school system’s annual budget, but that portion often amounts to a considerable sum worth tens of millions of dollars that can be used at the School Board’s discretion. Over the past 10 years, the leftover funds have added up to more than $305 million.
While the board often elects to use the extra funds to balance the following year’s budget, a sizable figure has been used for what amounts to a school system wish list. The outlays in recent years have included $400,000 for BlackBerry smartphones for administrative staff, $500,000 for adding automatic external defibrillators at schools, $693,000 to place assistant principals in all elementary schools and $375,000 to expand a culinary arts program.
All while the School Board has stared down deficits. In 2015, for example, the school system must address a projected $195 million deficit driven by rising enrollment figures and compensation needs. The school system had about $55 million left over this year and will use about $10 million of that to purchase new school buses and add three positions to the system’s legal staff.
Arthur Purves, president of the Fairfax County Taxpayers Alliance, said he thinks the school system’s millions of dollars in leftover cash are a symptom of a larger problem. He said the extra money, when combined with tens of millions of dollars in reserves and other “extraneous” items, suggests significant “padding” in the annual budget.
“It is suspect,” Purves said, adding that, as a “persnickety tax watchdog,” he thinks the school system budget is bloated with such expenses.Related: Fairfax plans to spend $2,500,000,000 during the 2013-2014 school year for 184,625 students or $13,541/student, about 14.4% less than Madison’s per student spending.
Daytona State, school districts reach agreements on dual enrollment
As opening days for fall classes draw near, agreements in support of dual enrollment have been reached between Daytona State College and Volusia and Flagler school districts.
The college’s District Board of Trustees on Aug. 13 approved agreements to cover the majority of the schools’ costs for services associated with dual enrollment in 2013-14.
The Volusia and Flagler school boards will vote on the agreements in upcoming weeks.
Dual enrollment provides college-credit classes on Daytona State campuses, giving college-bound students a head start on their higher education, at no cost to them.Related:Obtaining credit for non Madison School District Courses has been an ongoing challeng. Perhaps this issue has faded away as past practices die? Madison’snon-diverse or homogeneous governance model inflictsnumerous cost, fromone size fits all curricula to growth in the ‘burbs accompanied byever increasing property taxes on top of stagnant or declining income.
The Dichotomy of Madison School Board Governance: “Same Service” vs. “having the courage and determination to stay focused on this work and do it well is in itself a revolutionary shift for our district”.
The dichotomy that is Madison School Board Governance was on display this past week.
1. Board Member TJ Mertz, in light of the District’s plan to continue growing spending and property taxes for current programs, suggests that “fiscal indulgences“:Tax expenditures are not tax cuts. Tax expenditures are socialism and corporate welfare. Tax expenditures are increases on anyone who does not receive the benefit or can’t hire a lobbyist…to manipulate the code to their favor.
be applied to certain school volunteers.
This proposal represents a continuation of the Districts’ decades long “same service” approach to governance, with declining academic results that spawned the rejected Madison Preparatory IB Charter School.
2. Madison’s new Superintendent, Jennifer Cheatham introduced her “Strategic Framework” at Wednesday’s Downtown Rotary Club meeting.
The Superintendent’s letter (jpg version) (within the “framework” document) to the Madison Community included this statement (word cloud):Rather than present our educators with an ever-changing array of strategies, we will focus on what we know works and implement these strategies extremely well. While some of the work may seem familiar, having the courage and determination to stay focused on this work and do it well is in itself a revolutionary shift for our district. This is what it takes to narrow and eliminate gaps in student achievement.
The Madison School Board’s letter (jpg version) to the community includes this statement:
Public education is under sustained attack, both in our state and across the nation. Initiatives like voucher expansion are premised on the notion that public schools are not up to the challenge of effectively educating diverse groups of students in urban settings.
We are out to prove that wrong. With Superintendent Cheatham, we agree that here in Madison all the ingredients are in place. Now it is up to us to show that we can serve as a model of a thriving urban school district, one that seeks out strong community partnerships and values genuine collaboration with teachers and staff in service of student success.
Our Strategic Framework lays out a roadmap for our work. While some of the goals will seem familiar, what’s new is a clear and streamlined focus and a tangible and energizing sense of shared commitment to our common goals.
The bedrock of the plan is the recognition that learning takes place in the classroom in the interactions between teachers and students. The efforts of all of us – from school board members to everyone in the organization – should be directed toward enhancing the quality and effectiveness of those interactions.
There is much work ahead of us, and the results we are expecting will not arrive overnight. But with focus, shared effort and tenacity, we can transform each of our schools into thriving schools. As we do so, Madison will be the school district of choice in Dane County.Madison School Board word cloud:
North Carolina Gov. Pat McCrory, a Republican, signed a budget bill Friday that eliminates teacher tenure and–in a rare move–gets rid of the automatic pay increase teachers receive for earning a master’s degree.
The legislation targets a compensation mechanism that is common in the U.S., where teachers receive automatic pay increases for years of service and advanced degrees. Some research has suggested those advanced degrees don’t lead to improved teaching.
Although a few other states have talked about doing away with the automatic pay increase for advanced degrees, experts say North Carolina is believed to be the first state to do so.
The budget bill–which drew hundreds of teachers to the Capitol in protest earlier this week–also eliminates tenure for elementary and high-school teachers and freezes teacher salaries for the fifth time in six years.
It comes as states and districts across the country are revamping teacher evaluations, salaries and job security, and linking them more closely to student performance. These changes have been propelled, in part, by the Obama administration and GOP governors.The challenge for Madison is moving away from long time governance structures and practices, including a heavy (157 page pdf & revised summary of changes) teacher union contract. Chris Rickert’s recent column on Madison’s healthcare practices provides a glimpse at the teacher – student expenditure tension as well.
Then Ripon Superintendent Richard Zimman’s 2009 Madison Rotary speech offers important background on Madison’s dichotomy:“Beware of legacy practices (most of what we do every day is the maintenance of the status quo), @12:40 minutes into the talk – the very public institutions intended for student learning has become focused instead on adult employment. I say that as an employee. Adult practices and attitudes have become embedded in organizational culture governed by strict regulations and union contracts that dictate most of what occurs inside schools today. Any impetus to change direction or structure is met with swift and stiff resistance. It’s as if we are stuck in a time warp keeping a 19th century school model on life support in an attempt to meet 21st century demands.” Zimman went on to discuss the Wisconsin DPI’s vigorous enforcement of teacher licensing practices and provided some unfortunate math & science teacher examples (including the “impossibility” of meeting the demand for such teachers (about 14 minutes)). He further cited exploding teacher salary, benefit and retiree costs eating instructional dollars (“Similar to GM”; “worry” about the children given this situation).
“Budget Cuts: We Won’t Be as Bold and Innovative as Oconomowoc, and That’s Okay”.


Stagnant School Governance; Tax & Spending Growth and the “NSA’s European Adventure”
The Madison School District’s recent rhetoric around annual property tax increases (after a significant increase in redistributed state tax dollars last year and a “return to normal” this year) is, to the ongoing observer, unsurprising. We appear to be in the Rainwater era “same service” approach to everything, from million$ spent on a partially implemented Infinite Campus to long-term disastrous reading scores.
Steve Coll’s 5 July 2013 New Yorker column nails it:The most likely explanation is that President Obama never carefully discussed or specifically approved the E.U. bugging, and that no cabinet-level body ever reviewed, on the President’s behalf, the operation’s potential costs in the event of exposure. America’s post-September 11th national-security state has become so well financed, so divided into secret compartments, so technically capable, so self-perpetuating, and so captured by profit-seeking contractors bidding on the next big idea about big-data mining that intelligence leaders seem to have lost their facility to think independently. Who is deciding what spying projects matter most and why?
Much more on annual local property tax increases, here:
The Madison School Board should limit the school property tax hike to the rate of inflation next year, even if that means scaling back a proposed 1.5 percent across-the-board salary increase for school district employees, says member Mary Burke.
“I think in an environment where we’ve seen real wages in Dane County decrease, and a lot of people are on fixed incomes, we have to work as hard as possible to limit any increase to the inflation rate,” Burke said Tuesday in an interview.
…
But School Board discussions have focused around reducing the proposed salary hike, and cutting back on facility maintenance to pare down the $392 million proposed budget enough to bring the property tax increase to 4 or 5 percent, board President Ed Hughes told me.
The district under state law could increase its levy by as much as $18,385,847 or 9 percent. Keeping the increase to around the rate of inflation would mean an increase of less 2 percent.
…
Board member TJ Mertz can’t vote on salaries because his wife is a teacher’s aide with the school district, he told me, but he has long been outspoken in his belief in good pay for teachers to ensure the best academic achievement for students.
“As a citizen, I understand our staff needs to be compensated,” he said, adding that teachers have taken losses in take-home pay since they were required to begin making contributions to their pensions in 2011. “If the state won’t invest in our children, it has to come from the property tax,” he said.
Mertz said he would prefer a tax increase steeper than the 4 percent or 5 percent the board as a whole is focusing on. “I firmly believe the most important thing we can do is invest in our students; the question should not be what property tax levy can we afford,” he said.I appreciate Schneider’s worthwhile questions, including a discussion of “program reviews”:
Several School Board members interviewed for this story stressed that the 2013-2014 budget will be a transitional one, before a broad re-evaluation of spending planned by Cheatham can be conducted.
Yet, it would be useful to ask if in fact programs will be reviewed and those found wanting eliminated. The previous Superintendent, Dan Nerad, discussed program reviews as well.
Madison Schools’ 2013-2014 Budget Charts, Documents, Links, Background & Missing Numbers.
The Madison School Board seat currently occupied by Mr. Hughes (Seat 7, and Seat 6 – presently Marj Passman) will be on the Spring, 2014 ballot (candidate information is available at the Madison City Clerk’s website).
Redux: Up, Down & Transparency: Madison Schools Received $11.8M more in State Tax Dollars last year, Local District Forecasts a Possible Reduction of $8.7M this Year; taxes up 9% a few years ago
Madison’s aid amount is about the same as it was in 2010-11. The district received a $15 million boost in aid last year mostly because 4-year-old kindergarten enrollment added about 2,000 students.
The Madison School Board taxed the maximum amount allowed last year, resulting in a 1.75 percent property tax increase. That amount was low compared to previous years because of the state aid increase. The additional funds allowed the district to spend more on building maintenance and a plan to raise low-income and minority student achievement.
Property tax increase coming
Cheatham said she hopes to propose a lower property tax increase than 6.8 percent when she introduces her budget on July 15. A group of local and national experts recently advised the district that it should reallocate more funding from the administration into classrooms. Cheatham expects to do a deeper review of district finances for the 2014-15 budget.
“I would not be reluctant to ask the taxpayers of Madison to support us with additional funding moving forward if I knew that we were spending every dollar in the best possible way to support the students in our school district,” Cheatham said. “I’ll know that next budget cycle.”
To reduce the budget, Cheatham said she doesn’t expect any major changes that will affect classroom learning.
Instead she could cut a 1.5 percent proposed increase in the employee salary schedule, reduce maintenance spending or make some previously recommended reductions in administrative positions.Much more in the 2013-2014 budget, here.
Related: Up, Down & Transparency: Madison Schools Received $11.8M more in State Tax Dollars last year, Local District Forecasts a Possible Reduction of $8.7M this Year.
Madison spends significantly more per student than most districts. Property taxes were increased 9% just a few years ago.
Finally the ongoing tax increases may play a role in Madison School Board member Mary Burke’s rumored race for Governor
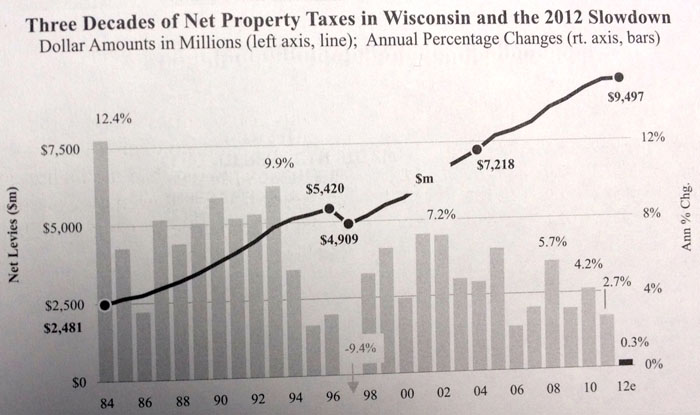
Voucher Commentary from Madison’s new School Board President
2013-2014 Madison School Board President Ed Hughes:
The proponents of the proposed expansion of Wisconsin’s private-school voucher program have run out of substantive arguments. Governor Walker’s “This is about children” illustrates how vacuous their efforts at persuasion have become.
When Governor Walker’s budget was first announced, his initial talking points in support of his voucher expansion plan featured the claim that schools in the nine targeted school districts were failing and vouchers were necessary to provide a lifeline to students who needed help to pursue other schooling options. Neither the governor nor his supporters are pushing that argument any more. It seems that they got the point that it is not a smart move politically for the governor to go around trashing the public schools in some of the larger urban areas of the state.
While proponents have claimed that students in voucher schools do better academically, the wind has gone out of the sails of that argument as well. DPI has reported that students in voucher schools in Milwaukee and Racine performed worse on the WKCE than students in the public schools in those communities. Voucher school advocates can point to data that supposedly support their view, opponents can counter with contrary figures, and at best the evidence on improved student performance is a wash. There is no reason to think that students in the nine districts targeted for voucher expansion would do any better in the private schools in their area than they would in their neighborhood public schools. No one has offered an argument to the contrary.
Voucher proponents sometimes try to construct a cost-savings argument around the fact that the per-pupil amounts that voucher students would receive are less than the average per-pupil expenditures by their school districts. But this argument goes nowhere because no one is proposing that the public schools shut down as voucher schools expand. Consequently, there’s really not much of a response to the observation credited to former Governor Tommy Thompson that “We can’t afford two systems of education.”
Additionally, voucher schools have not discovered a magic bullet that allows them to educate students across the spectrum of needs more economically. Here’s a telling excerpt from an op ed by the Choice Schools Association advocating for much higher voucher payments and posted on line by the right-wing MacIver Institute:Vouchers are hardly an existential threat to the Madison School District. Rather, the District’s long term disastrous reading scores are the essential issue, one that merits endless attention and improvement.
2005: When all third graders read at grade level or beyond by the end of the year, the achievement gap will be closed…and not before.
Milwaukee Schools’ $1,170,867,945 Budget Outlook A Little Brighter
I had my first chance to read through the new Milwaukee Public School (MPS) budget proposal yesterday, and I must say, I was pleasantly surprised. Compared to trends of the last decade or so, things are definitely looking better for the district.
Most important, MPS is increasing their staffing in key areas next year. Despite all the talk about governance structure the most important place in education is the school itself. MPS is increasing its school level staffing by 120.8 full-time-equivalent employees in FY14. A good number of those positions, 51, are teachers and educational assistants (though on the negative side the federal sequestration is responsible for the loss of 24 title 1 teachers). The district is also adding assistant principals, safety assistants, social workers, and nurse associates in schools. All of this is particularly impressive when overall enrollment is projected to decline 1%.
So how did they do this? A big part is the aggressive action the district has taken to reduce its benefit costs. MPS notes in their budget that their average teacher salary is increasing but their “school operations and categorical benefit” rate will drop to 58.4% from almost 70% just two years ago. Part of this is due to Act 10, and part of this is due to the willingness of MPS to take needed action.Milwaukee’s $1,170,867,945 budget will spend $15,011 for each of its 78,000 students during the 2013-2014 school year. Madison spends a similar amount per student.
Madison’s Sherman Middle School to drop French 1 class
The way Principal Michael Hernandez tells it, something had to go.
Hernandez decided that at Sherman Middle School, it will be French class.
With a renewed emphasis on curriculum basics in the Madison School District, the need at Sherman to double-down on math skills, and a scheduled expansion there of the AVID program that prepares low-income minority kids for college, Hernandez figures the north-side middle school will need to drop its second “world language” offering next year.
French 2 will continue for seventh-graders who took French 1 this year. The school’s Spanish-language program — including three sections of dual-language instruction — also will continue.
“Unfortunately, there are tough decisions we have to make,” Hernandez told me. “With budget cuts, I can’t have a class with only approximately seven students, when I could use that (staff) allocation for a math intervention class.”
Principals will be developing these kinds of adjustments around the margins to prepare for the 2013-2014 school year as district officials begin work on the budget and schools get projections on how many staff members they will have.
School Board members on Monday will receive a “budget briefing” instead of fleshed-out budget proposal. Penciled in is $392,807,993 in district-wide spending next school year, down a fraction from this year.
The scaled-down budget proposal is due to the uncertain prospects of a controversial proposal in Gov. Scott Walker’s budget to shift aid and expand vouchers to Madison and eight other school districts — at a projected cost of more than $800,000 to the Madison public schools. In addition, new Superintendent Jennifer Cheatham just came on the job three weeks ago and is not prepared yet to present a detailed budget.
College admission may get easier as ranks of high school graduates drop
High school graduates will face less competition for college admission in the next decade due to a demographic decline in their ranks, according to a report on education enrollment trends released Wednesday.
At the same time, Latinos and Asian Americans will constitute larger shares of high school populations and the numbers of white and black students will drop.
“Over the last two decades, colleges and universities have been able to count on an annually growing number of students graduating from the nation’s high schools. But it appears that period of abundance will soon be history,” said the study, Knocking at the College Door, issued by the Western Interstate Commission for Higher Education.
Postsecondary campuses will have to recruit more heavily, possibly reaching beyond typical geographic territories and turning to older adults and other nontraditional populations, the report said.
The number of high school graduates increased nationally for a decade, peaking at 3.4 million in 2010-11, but then lower birth rates and less immigration contributed to a decline. Estimates show 3.21 million graduates are expected in 2013-2014, according to the report. Then it projects small ups and downs until 2023-24, when high school graduates will reach 3.4 million again.
APPROVE MADISON PREP NON-INSTRUMENTALITY
Don Severson, via a kind email:
The Madison Metropolitan School District Board of Education will vote December 19, 2011, on the Madison Preparatory Academy proposal for non-instrumentality charter school authorization. Active Citizens for Education endorses and supports the approval of the proposal.
In addition to the rationale and data cited by the Urban League of Greater Madison, and significant others throughout the Madison community, supporting the curricular, instructional, parental and behavioral strategies and rigor of the school, ACE cites the following financial and accountability support for approval of the Academy as a non-instrumentality charter school.
- Financial: Should the Board deny approval of the proposal as a non-instrumentality the District stands to lose significant means of financial support from state aids and property tax revenue. The District is allowed $10,538.54 per student enrolled in the District the 2011-12 school year. With the possibility of Madison Prep becoming a private school if denied charter school status, the 120 boys and girls would not be enrolled in MMSD; therefore the District would not be the beneficiary of the state and local revenue. The following chart shows the cumulative affect of this reduction using current dollars:
2012-2013 6th grade 120 students @10,538.54 = $1,264,624.80
2013-2014 2 grades 240 students @10,538.54 = $2.529,249.60
2014-2015 3 grades 360 students @10,538.54 = $3,793,874.40
2015-2016 4 grades 480 students @10,538.54 = $5,058,499.20
2016-2017 5 grades 600 students @10,538.54 = $6.323.124.00
2017-2018 6 grades 720 students @10,538.54 = $7,587,748.80
2018-2019 7 grades 840 students @10,538.54 = $8,852,373.60
This lost revenue does not include increases in revenue that would be generated from improved completion/graduation rates (currently in the 50% range) of Black and Hispanic students resulting from enrollees in a charter school arrangement.- Accountability: The MMSD Administration and Board have been demonstrating a misunderstanding of the terms ‘accountability’ and ‘control’. The State charter school law allows for the creation of charter schools to provide learning experiences for identified student groups with innovative and results-oriented strategies, exempt from the encumbrances of many existing state and local school rules, policies and practices. Charter schools are authorized and designed to operate without the ‘controls’ which are the very smothering conditions causing many of the problems in our public schools. The resulting different charter school environment has been proven to provide improved academic and personal development growth for learners from the traditional school environment. Decreasing impediments and controls inhibiting learning increases the requirements for ‘accountability’ to achieve improved learner outcomes on the part of the charter school. Should the charter school not meet its stated and measurable goals, objectives and results then it is not accountable and therefore should be dissolved. This is the ‘control’ for which the Board of Education has the authority to hold a charter school accountable.
Let us describe an analogy. Private for-profit business and not-for-profit organizations are established to provide a product and/or service to customers, members and the public. The accountability of the business or organization for its continued existence depends on providing a quality product/services that customers/members want or need. If, for whatever reasons, the business or organization does not provide the quality and service expected and the customer/member does not obtain the results/satisfaction expected, the very existence of the business/organization is jeopardized and may ultimately go ‘out of business’. This scenario is also absolutely true with a charter school. It appears that the significant fears for the MMSD Administration and Board of Education to overcome for the approval of the proposed non-instrumentality Madison Prep charter school are: 1) the fear of loss of ‘control’ instead of accepting responsibility for ‘accountability’, and 2) the fear that ‘some other organization’ will be successful with solutions and results for a problem not addressed by themselves.The MMSD Board of Education is urged to approve the proposed Madison Preparatory Academy non-instrumentality charter school proposal; thereby, relieving the bondage which grips students and sentences them to a future lifetime of under-performance and lack of opportunities. Thank you.
Contact: Don Severson, President, 608 577-0851, donleader@aol.comMuch more on the proposed Madison Preparatory IB charter school, here.
The Madison School District Plans to Expand its Dual Language Immersion Program
Elementary School Level DLI: Proposal to plan and implement DLI programs at Stephens, Thoreau, and Hawthorne Elementary Schools for the 2011-2012 School year. Given the ongoing increase in the number of Spanish-speaking English language learners, MMSD needs to implement bilingual education programming in order to meet legal requirements imposed by the state statutes. It is recommended we start planning at these three sites during the 2011-2012 school year for program implementation during the 2012-2013 school year starting with a Kindergarten cohort.
La Follette High School Dual Language Immersion Program Proposal Update: A committee has been formed to start developing a proposal to bring to the BOE for a high school DLI continuation program. The committee is made up of representatives from the district ESLIBE/DLI Division as well as administrators and staff from La Follette High School. The committee meets biweekly. This high school DLI program would
serve the needs of students in the Sennett DLI program. The students are scheduled to start their high school programming during the 2013-2014 school year. A proposal is scheduled to be presented to the BOE in May of 2011 .Additional language options, particularly for elementary students will be good news. Nearby Verona launched a Mandarin immersion charter school recently.
