Search Results for: Spends double the national average
Wisconsin spends approximately 35 percent more per pupil, yet it achieves worse results
Chad Aldeman: “The average Black student in Mississippi performed about 1.5 grade levels ahead of the average Black student in Wisconsin. Just think about that for a moment. Tim Daly: Mississippi Can’t Possibly Have Good SchoolsAnd yet it does. Are we ready to deal? Underperforming states escape scrutiny. Our biases prevent us from asking, for […]
Madison Superintendent Jennifer Cheatham proposes $31 million, five-year technology plan
All students in the Madison School District would have their own tablets or notebook computers by the 2018-19 school year under a five-year, $31 million plan proposed by Superintendent Jennifer Cheatham.
If approved, the plan would increase the district’s current
$1.5 million annual technology budget to $4.2 million in the 2014-15 school year to start upgrading the district’s network infrastructure, upgrade or equip classrooms and libraries with new technology or computers, and provide notebook computers to all district teachers and administrators. Elementary teachers also would get tablet computers under the plan.
Costs to upgrade are projected to increase each of the five years of the plan for a total of $31 million spent in that time. Afterward, the annual budget for technology would be about $7 million per year going forward.
…..
Madison School Board members, who formally received the plan at their meeting Monday, were mostly optimistic about the plan. Board member T.J. Mertz questioned whether the program needed to be as extensive as it’s proposed given what he said were other unmet needs in the district and given research that he called “universally disappointing” surrounding such initiatives.
Mertz said in an interview after Monday’s board meeting that he agrees with the majority of the investments in technology under the plan, “but then there’s a third or a quarter where I think it’s going overboard.”
As an example, Mertz said he questions whether every kindergarten student needs their own tablet computer.Prior to spending any additional taxpayer funds on new initiatives, I suggest that the District consider (and address) the status of past expensive initiatives, including:
Infinite Campus: is it fully implemented? If not, why? Why continue to spend money on it?
“Standards based report cards“.
Connected Math.
Small Learning Communities.
And of course, job number one, the District’s long term disastrous reading scores.
Madison already spends double the national average per student ($15k). Thinning out initiatives and refocusing current spending on reading would seem to be far more pressing than more hardware.
“The notion that parents inherently know what school is best for their kids is an example of conservative magical thinking.”; “For whatever reason, parents as a group tend to undervalue the benefits of diversity in the public schools….”
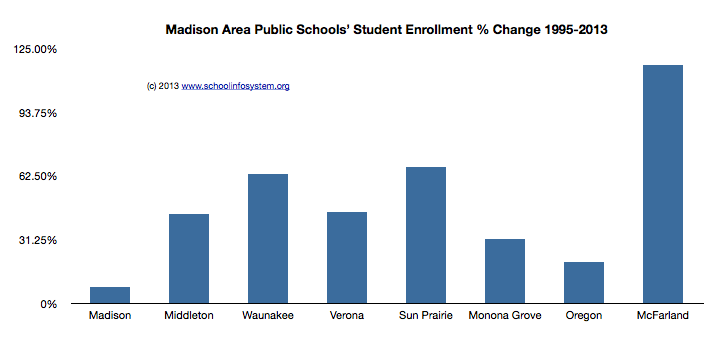
Where have all the students gone?
Madison School Board President Ed Hughes:Esenberg sets out to identify the fundamental differences between voucher advocates and opponents. His thesis is that views on vouchers derive from deeper beliefs than objective assessments of how well voucher schools perform or concerns about vouchers draining funds from public schools. To him, your take on vouchers depends on how you view the world.
Esenberg asserts that voucher advocates are united by their embrace of three fundamental principles: that a centralized authority is unlikely to be able to decide what is best for all; that families should be trusted to select their children’s schools since ordinary people are capable of making choices for themselves without paternalistic direction; and that “government does not do diversity, experimentation and choice very well.”
By implication, he asserts that voucher opponents think that a centralized authority will be able to decide what’s best for all, that families shouldn’t be trusted to make choices for their children, and that government control is the best way to foster innovation.
And there you have it. Your views on school voucher expansion are entirely explained by whether you prefer individual freedom, like the voucher advocates, or stultifying government control, like the voucher opponents. In cinematic terms, voucher opponents are the legions of lifeless, gray drones in Apple’s famous 1984 commercial and voucher supporters are the colorful rebel, bravely challenging the control of Big Brother and hurling her sledgehammer to smash mindless conformity. You couldn’t ask for a more sophisticated analysis than that, could you?
While his thesis invites mockery, Esenberg’s short article does present a bit of a challenge to voucher opponents like myself. Can we set out a coherent justification for our opposition that doesn’t depend on the facts that voucher schools drain needed resources from public schools and don’t perform any better? Sweeping those fairly compelling points aside, Esenberg asks, in effect, what else you got?Mr Hughes anti-voucher rhetoric is fascinating on several levels:
1. The Madison School District’s long term, disastrous reading results. How much time and money has been wasted on anti-voucher rhetoric? Reading has long been job one.
2. Local private schools do not have much, if any availability.
3. Madison spends double the national average per student (some of which has been spent on program explosion). Compare Milwaukee Public and Voucher Schools’ Per Student Spending.
4. Madison’s inability to address its long-term disastrous reading results will bring changes from State or Federal legislation or via litigation.
5. Superintendent Cheatham cited Long Beach and Boston as urban districts that have “narrowed the achievement gap”. Both districts offer a variety of school governance models, which is quite different than Madison’s long-time “one size fits all approach”.
I recall being astonished that previous Madison School District administrators planned to spend time lobbying at the State level for this or that change – while “Rome is burning“. Ironically, Superintendent Cheatham recently said:“Rather than do a lot of work on opposing the voucher movement, we are going to focus on making sure our schools are the best schools possible and the schools of choice in Madison,” Cheatham said.
This points up one of the frustrating aspects of trying to follow school issues in Madison: the recurring feeling that a quoted speaker – and it can be someone from the administration, or MTI, or the occasional school board member – believes that the audience for an assertion is composed entirely of idiots.
A great, salient quote. I would hope that the District would focus completely on the matter at hand, disastrous reading scores. Taking care of that problem – and we have the resources to do so – will solve lots of other atmospheric and perception issues.
In closing, I sense politics in the voucher (and anti-open enrollment) rhetoric. Two Madison School Board seats will be on the Spring, 2014 ballot. One is currently occupied by Mr. Hughes, the other by Marj Passman. In addition, local politics play a role in becoming school board President.
K-12 Tax & Spending Climate: US Median Household Income Lower Than 1996..
Economist Taken as a whole, Ms Clinton’s plan is an eclectic grab-bag. It is as if her advisors brainstormed every possible policy to boost wages, and then kept them all. Some—such as greater investment in skills and infrastructure—are welcome. Wages, ultimately, reflect workers’ productivity. Ms Clinton is also right that the impact of technology on […]
Diminishing Returns in Wisconsin K-12 Education Spending Growth
Tap to view a larger version of these images. Martin F. Lueken, Ph.D., Rick Esenberg & CJ Szafir, via a kind reader (PDF): Robustness checks: Lastly, to check if the estimates from our main analysis behave differently when we modify our models, we conduct a series of robustness checks in our analysis. We estimate models […]
School should be year-round
Wausau Daily Herald: More than 40 percent of Wausau School District students are attending summer school this year. That’s about the same proportion of students who took summer classes last year, and it’s considered pretty good participation for the Summer Learning program. It should be 100 percent. A three-month summer vacation is bad for students, […]
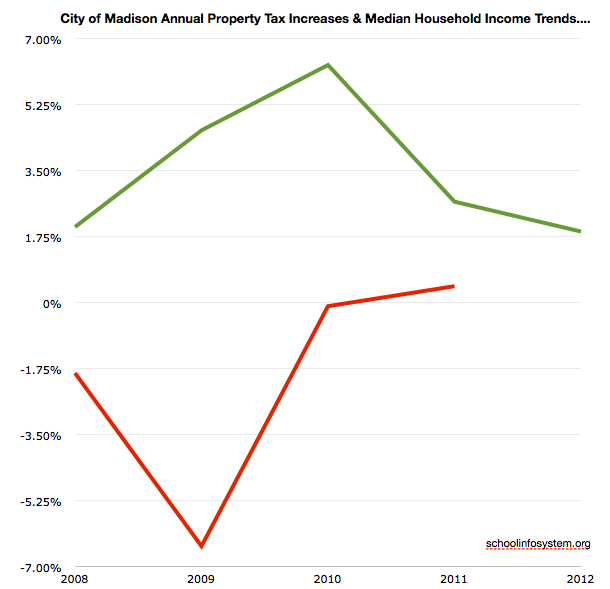
Trial Balloon on Raising Madison’s Property Taxes via another School Referendum? Homeowners compare communities…..
Molly Beck There’s been little movement since mid-March when Madison School District Superintendent Jennifer Cheatham proposed asking voters in November for $39.5 million in borrowing to upgrade facilities and address crowding. The proposed referendum’s annual impact on property taxes on a $200,000 Madison home could range from $32 to $44, according to the district. After […]
Madison Schools’ Tax & Spending Priorities
Chris Rickert: District officials were able to close about a third of the budget deficit by negotiating rate freezes with the three insurers it contracts with for employee health coverage — which is great, but isn’t going to put any more of those 79 positions back in the classroom. The district, like local taxing bodies […]
Healthcare Costs & The Madison School District
Pat Schneider: “I will consider contributions to health care, depending on what we see in terms of costs and the budget,” Burke said. “But we need to look at compensation in its entirety to make sure we remain competitive while we are accountable to the taxpayers.” The school district is in the process of preparing […]
deja vu: Madison, 2015
2005: When all third graders read at grade level or beyond by the end of the year, the achievement gap will be closed…and not before On November 7, Superintendent Art Rainwater made his annual report to the Board of Education on progress toward meeting the district’s student achievement goal in reading. As he did last […]
School Voucher Climate Commentary
Jessica Arp: “My main concern is that right now we are at a 20-year low in funding for public education so our public schools are already in a state of crisis,” Moffit said. Sierra disagrees and said vouchers are really about choice. “We pay taxes also,” Sierra said. “Nothing against public schools, but we decided […]
Commentary on Wisconsin’s K-12 Tax, Spending & Governance Climate
Madison Teachers, Inc. Newsletter, via a kind Jeanie Kamholtz email (PDF): It has been a long, well-planned attack. In 1993, in an action against their own philosophy; i.e. decisions by government should be made at the lowest possible level, the Republican Governor and Legislature began actions to control local school boards. They passed Revenue Controls […]
Education and class: America’s new aristocracy
The Economist: WHEN the candidates for the Republican presidential nomination line up on stage for their first debate in August, there may be three contenders whose fathers also ran for president. Whoever wins may face the wife of a former president next year. It is odd that a country founded on the principle of hostility […]
Madison Plans 4.2% Property Tax Increase
Molly Beck: The Madison School District property tax levy would increase by 4.2 percent under the district’s final budget proposal. That’s up from a 2 percent increase contained in the district’s preliminary budget approved in June. The final 2014-15 district budget, which must be adopted by the School Board by Nov. 1, also includes a […]
K-12 Tax & Spending Climate: Madison/Dane County Property Taxes Highest in Wisconsin, 61st in USA
Nick Heynen: Using data from the Census Bureau’s American Community Survey, the report’s authors examined residential property taxes in every U.S. county from 2007 to 2011, looking at how much homeowners were paying on average and how that average compared to average home sale prices over the same time period. The data contained some interesting, […]
Apartheid, just less black and white: ‘Inequality is the new apartheid. “Your life path is largely determined before birth’; Kansas City & Madison per student spending fails to address the gap
Simon Kuper I especially see apartheid in the US. True, the country has made racist speech taboo. Use a racial epithet in public and your career combusts. That’s lovely. However, American school taxes are usually raised locally, and many neighbourhoods are segregated, and so most poor black children attend underfunded schools where they learn just […]
Choice, Not More Spending, Is Key To Better Schools; Wisconsin 12th in Spending, 24th in Achievement
W. Michael Cox & Richard Alm Education looms as both cause and cure for the decline of the middle class and the widening gap between rich and poor. In today’s knowledge-based economy, poorly performing public schools leave many U.S. workers ill-equipped for jobs that pay middle-class wages. So it follows that improving education is the […]
Elementary Data: Madison’s Proposed $39,500,000 Maintenance & Expansion Referendum
Madison Schools’ March, 2014 Facility Plan (PDF):: Shorewood Elementary: In conjunction with building an elevator tower, add a four-classroom addition. The additional classrooms are a relatively easy gain based on the building design. Shorewood’s 2013-2014 Low Income Population: 33.8%; All Madison Elementary Schools: 52.1% 2012-2013 Basic & Minimal Reading Proficiency: 34.3% Madison School District: 62.5% […]
Compare Madison Area Property Taxes
The Wisconsin State Journal offers a page to compare property taxes on a $200,000 home, here.
Related:
Madison’s 2013-2014 budget and commentary on Madison and Surrounding School Districts; Middleton’s lower Property Taxes.
Much more, here.
Madison spends about $15K per student, roughly double the national K-12 average, yet has long generated disastrous reading results.


PISA 2012 Results & Commentary: “US Mediocre, Expensive”
PISA 2012 is the programme’s 5th survey. It assessed the competencies of 15-year-olds in reading, mathematics and science (with a focus on mathematics) in 65 countries and economies.
Around 510 000 students between the ages of 15 years 3 months and 16 years 2 months participated in the assessment, representing about 28 million 15-year-olds globally.
The students took a paper-based test that lasted 2 hours. The tests were a mixture of open-ended and multiple-choice questions that were organised in groups based on a passage setting out a real-life situation. A total of about 390 minutes of test items were covered. Students took different combinations of different tests. They and their school principals also answered questionnaires to provide information about the students’ backgrounds, schools and learning experiences and about the broader school system and learning environment.Among the 34 OECD countries, the United States performed below average in mathematics in 2012 and is ranked 26th…Performance in reading and science are both close to the OECD average. The United States ranks 17 in reading, (range of ranks: 14 to 20) and 21 in science (range of ranks: 17 to 25). There has been no significant change in these performances over time.
Mathematics scores for the top-performer, Shanghai-China, indicate a performance that is the equivalent of over two years of formal schooling ahead of those observed in Massachusetts, itself a strong-performing U.S. state.
While the U.S. spends more per student than most countries, this does not translate into better performance. For example, the Slovak Republic, which spends around USD 53 000 per student, performs at the same level as the United States, which spends over USD 115 000 per student.
Just over one in four U.S. students do not reach the PISA baseline Level 2 of mathematics proficiency – a higher-than-OECD average proportion and one that hasn’t changed since 2003. At the opposite end of the proficiency scale, the U.S. has a below-average share of top performers.
Students in the United States have particular weaknesses in performing mathematics tasks with higher cognitive demands, such as taking real-world situations, translating them into mathematical terms, and interpreting mathematical aspects in real-world problems. An alignment study between the Common Core State Standards for Mathematics and PISA suggests that a successful implementation of the Common Core Standards would yield significant performance gains also in PISA.While these results always make news, this year there is an added tempest in the teapot of the education policy world: The OECD and the Obama administration worked in advance with a selected group of advocacy organizations to launch a media campaign called PISA Day. Which organizations? The College Board, ACT, America Achieves, and the Business Roundtable–all key architects of the Common Core, the new national curriculum standards whose increased rigor and standardized tests have led to a much-publicized protest movement among some parents, teachers, and kids. Groups that support the Core have an interest in calling attention to low American test scores, which today they will use to argue that the Core is the solution not only to our academic woes, but also to reviving the American economy. Happy PISA Day!
But the truth is that the lessons of PISA for our school reform movement are not as simple as they are often made out to be. PISA results aren’t just about K-12 test scores and curricula–they are also about academic ability tracking, income inequality, health care, child care, and how schools are organized as workplaces for adults.Not much has changed since 2000, when the U.S. scored along the OECD average in every subject: This year, the U.S. scores below average in math and ranks 17th among the 34 OECD countries. It scores close to the OECD average in science and reading and ranks 21st in science and 17th in reading.
Here are some other takeaways from the report:
America Is Struggling at Math
The U.S. scored below the PISA math mean and ranks 26th out of the 34 OECD countries. The U.S. math score is not statistically different than the following countries: Norway, Portugal, Italy, Spain, Russian Federation, Slovak Republic, Lithuania, Sweden, and Hungary.
Do American Schools Need to Change? Depends What You Compare Them To
On average, 13 percent of students scored at the highest or second highest level on the PISA test, making them “top performers.” Fifty-five percent of students in Shanghai-China were considered top performers, while only nine percent of American students were.For the last few years, many U.S. educators and policy makers have looked to Finland, noting its high test scores and laser-like focus on attracting and retaining the best teachers. Although Finland still posts high scores, they have slid in the past few years.
Poland, on the other hand, has seen sharp improvement. The only European country to have avoided the recession, Poland undertook a host of education overhauls in 1999, including delaying by one year the system that places students into academic or vocational tracks, and crafting better systems to identify struggling students and get them help.
“Poland launched a massive set of reforms and, while we cannot say for sure they caused the improvement, they certainly are…a sort of plausible explanation,” said Andreas Schleicher, deputy director for education and skills at the OECD.
In Massachusetts, educators and policy makers credit the good showing, in part, to a 1993 effort that boosted spending and ushered in rigorous standards and achievement tests that students have to pass to graduate.Related: www.wisconsin2.org
Legislation could boost old Madison Prep proposal
More important than whether UW-Madison might take a chance on Madison Prep, though, is whether such a school chartered by UW-Madison would work. Caire said “higher education institutions tend to be more careful about who gets a charter and tend to charter some high-quality schools.”
There appears to be some evidence of this. Ten of 11 UW-Milwaukee-authorized charters have an average state report card score some 14 points higher than the Milwaukee Public Schools generally, with one charter school not rated.
The MPS and charter schools have comparable rates of poverty, although MPS schools have higher proportions of disabled students and English language learners. A special state test for disabled students and other accommodations can help mitigate the negative effect on a school’s overall performance but not necessarily completely, according to James Wollack, an associate professor and expert in testing and evaluation at UW-Madison.Much more on the Madison Preparatory Academy, an IB charter school proposal rejected by a majority of the Madison School Board.
Madison’s non-diverse K-12 governance model spends about double the national average per student yet has sustained disastrous reading results for some time. The “same service” governance model has long run its course.
Wasting Time Is New Divide in Digital Era
“Despite the educational potential of computers, the reality is that their use for education or meaningful content creation is minuscule compared to their use for pure entertainment,” said Vicky Rideout, author of the decade-long Kaiser study. “Instead of closing the achievement gap, they’re widening the time-wasting gap.”
July 29 Wisconsin Read to Lead task force meeting
The fourth meeting of the Governor’s Read to Lead task force took place in Milwaukee on Friday, July 29. The meeting was filmed by Wisconsin Eye, but we have not seen it offered yet through their website. We will send out a notice when that occurs. As always, we encourage you to watch and draw your own conclusions.
Following is a synopsis of the meeting, which centered on reading improvement success in Florida and previously-discussed task force topics (teacher preparation, licensing, professional development, screening/intervention, early childhood). In addition, Superintendent Evers gave an update on activity within DPI. The discussion of the impact of societal factors on reading achievement was held over to the next meeting, as was further revisiting of early childhood issues.
In addition to this summary, you can access Chan Stroman’s Eduphilia tweets at http://twitter.com/#!/eduphilia
Opening: Governor Walker welcomed everyone and stressed the importance of this conversation on reading. Using WKCE data, which has been criticized nationally and locally for years as being derived from low standards, the Governor stated that 80% of Wisconsin students are proficient or advanced in reading, and he is seeking to serve the other 20%. The NAEP data, which figured prominently in the presentation of the guest speakers, tell a very different story. Superintendent Evers thanked the task force members and indicated that this is all about “connecting the dots” and putting all of the “puzzle pieces” together. The work of this task force will impact the work going on in other education-focused committees.
The Florida Story: Guest speakers were Patricia Levesque, the Executive Director of the Foundation for Excellence in Education and the Foundation for Florida’s Future, and Mary Laura Bragg, the director of Florida’s statewide reading initiative, Just Read, Florida! from 2001 to 2006.
In a series of slides, Levesque compared Wisconsin, Florida, and national performance on the NAEP reading test over the past decade. Despite challenges in terms of English language learners, a huge percentage of students on free/reduced lunch, and a minority-majority demographic, Florida has moved from the scraping the bottom on the NAEP to the top group of states. Over the same time period, Wisconsin has plummeted in national ranking, and our students now score below the national average in all subgroups for which NAEP data is disaggregated. 10 points on the NAEP scale is roughly equivalent to one grade level in performance, and Florida has moved from two grade levels below Wisconsin to 1/2 grade level above. For a full discussion of Wisconsin’s NAEP performance, see our website, http://www.wisconsinreadingcoalition.org.
Levesque and Bragg also described the components of the reading initiative in Florida, which included grading all schools from A to F, an objective test-based promotion policy from third to fourth grade, required state-approved reading plans in each district, trained reading coaches in schools, research assistance from the Florida Center for Reading Research, required individual student intervention plans for struggling students, universal K-2 screening for reading problems, improved licensure testing for teachers and principals, the creation of a reading endorsement for teaching licenses, and on-line professional development available to all teachers. As noted above, achievement has gone up dramatically, the gap between demographic groups has narrowed, early intervention is much more common, and third grade retention percentages continue to fall. The middle school performance is now rising as those children who received early intervention in elementary school reach that level. Those students have not yet reached high school, and there is still work to be done there. To accomplish all this, Florida leveraged federal funds for Title 1 and 2 and IDEA, requiring that they be spent for state-approved reading purposes. The Governor also worked actively with business to create private/public partnerships supporting reading. Just Read, Florida! was able to engineer a statewide conference for principals that was funded from vendor fees. While Florida is a strong local control state, reading is controlled from the state level, eliminating the need for local curriculum directors to research and design reading plans without the resources or manpower to do so. Florida also cut off funding to university professors who refused to go along with science-based reading instruction and assessment.
Florida is now sharing its story with other states, and offering assistance in reading plan development, as well as their screening program (FAIR assessment system) and their online professional development, which cost millions to develop. Levesque invited Wisconsin to join Indiana and other states at a conference in Florida this fall.
Questions for, or challenges to, the presenters came from three task force members.
- Rachel Lander asked about the reading coaches, and Bragg responded that they were extensively trained by the state office, beginning with Reading First money. They are in the classroom modeling for teachers and also work with principals on understanding data and becoming building reading leaders. The coaches now have an association that has acquired a presence in the state.
- Linda Pils stated her belief that Wisconsin outperforms Florida at the middle school level, and that we have higher graduation rates than Florida. She cited opinions that third grade retention has some immediate effect, but the results are the same or better for non-retained students later, and that most retained students will not graduate from high school. She also pointed out Florida’s class size reduction requirement, and suggested that the NAEP gains came from that. Levesque explained that the retention studies to which Pils was referring were from other states, where retention decisions were made subjectively by teachers, and there was no requirement for science-based individual intervention plans. The gains for retained students in Florida are greater than for matched students who are not retained, and the gains persist over time. Further, retention did not adversely affect graduation rates. In fact, graduation rates have increased, and dropout rates have declined. The University of Arkansas is planning to do a study of Florida retention. The class size reduction policy did not take effect in Florida until last year, and a Harvard study concluded that it had no effect on student reading achievement. Task force member Steve Dykstra pointed out that you cannot compare the NAEP scores from two states without considering the difference in student demographics. Wisconsin’s middle school scores benefit from the fact that we have a relative abundance of white students who are not on free/reduced lunch. Our overall average student score in middle school may be higher than Florida, but when we compare similar cohorts from both states, Florida is far ahead.
- Tony Pedriana asked what kinds of incentives have been put in place for higher education, principals, etc. to move to a science-based system of instruction. The guests noted that when schools are graded, reading performance receives double weight in the formula. They also withheld funding for university programs that were not science-based.
DPI Update: Superintendent Evers indicated that DPI is looking at action in fours areas: teacher licensure, the Wisconsin Model Early Learning Standards, the use of a screener to detect reading problems, and implementation of the Common Core State Standards.
- The committee looking at licensing is trying to decide whether they should recommend an existing, off-the-shelf competency exam, or revise the exam they are currently requiring (Praxis 2). He did not indicate who is on the committee or what existing tests they were looking at. In the past, several members of the task force have recommended that Wisconsin use the Foundations of Reading test given in Massachusetts and Connecticut.
- DPI is revising the WMELS to correct definitions and descriptions of phonological and phonemic awareness and phonics. The changes will align the WMELS with both the Report of the National Reading Panel and the Common Core State Standards. Per the suggestion of Eboni Howard, a guest speaker at the last meeting, they will get an outside opinion on the WMELS when they are finished. Evers did not indicate who is doing this work.
- DPI is looking at the possibility of using PALS screening or some other tool recommended by the National RTI Center to screen students in grades K-2 or K-3. Evers previously mentioned that this committee had been meeting for 6-7 months, but he did not indicate who is on it.
- Evers made reference to communication that was circulated this week (by Dr. Dan Gustafson and John Humphries) that expressed concern over the method in which DPI is implementing the Common Core. He stated that districts have been asking DPI for help in implementing the CC, and they want to provide districts with a number of resources. One of those is the model curriculum being developed by CESA 7. DPI is looking at it to see how it could help the state move forward, but no final decision has yet been made.
Task force member Pam Heyde, substituting for Marcia Henry, suggested that it would be better to look at what Florida is doing rather than start from ground zero looking at guidelines. Patricia Levesque confirmed that Florida was willing to assist other states, and invited Wisconsin to join a meeting of state reading commissioners in October.
Teacher Preparation: The discussion centered around what needs to change in teacher preparation programs, and how to fit this into a four-year degree.
Steve Dykstra said that Texas has looked at this issue extensively. Most schools need three courses to cover reading adequately, but it is also important to look at the texts that are used in the courses. He referenced a study by Joshi that showed most of the college texts to be inadequate.
Dawnene Hassett, UW-Madison literacy professor in charge of elementary teacher reading preparation, was invited to participate in this part of the discussion. She indicated we should talk in terms of content knowledge, not number of credits. In a couple of years, teachers will have to pass a Teacher Performance Assessment in order to graduate. This was described as a metacognitive exercise using student data. In 2012-13, UW-Madison will change its coursework, combining courses in some of the arts, and dropping some of the pedagogical, psychological offerings.
Tony Pedriana said he felt schools of education had fallen down on teaching content derived from empirical studies.
Hassett said schools teach all five “pillars” of reading, but they may not be doing it well enough. She said you cannot replicate classroom research, so you need research “plus.”
Pils was impressed with the assistance the FCRR gives to classroom teachers regarding interventions that work. She also said spending levels were important.
Dykstra asked Mary Laura Bragg if she had worked with professors who thought they were in alignment with the research, but really weren’t.
Bragg responded that “there’s research, and then there’s research.” They had to educate people on the difference between “research” from vendors and empirical research, which involves issues of fidelity and validation with different groups of students.
Levesque stated that Florida increased reading requirements for elementary candidates from 3 to 6 credits, and added a 3 credit requirement for secondary candidates. Colleges were required to fit this in by eliminating non-content area pedagogy courses.
Kathy Champeau repeated a concern from earlier meetings that teacher candidates need the opportunity to practice their new knowledge in a classroom setting, or they will forget it.
Hassett hoped the Teacher Performance Assessment would help this. The TPA would probably require certain things to be included in the teacher candidate’s portfolio.
Governor Walker said that the key to the effectiveness of Florida’s retention policy was the intervention provided to the students. He asked what they did to make sure intervention was successful.
Levesque replied that one key was reading coaches in the classroom. Also, district reading plans, individual intervention plans, student academies, etc. all need to be approved by the state.
There was consensus that there should be a difference in reading requirements for elementary vs. secondary teachers. There was no discussion of preparation for reading teachers, reading specialists, or special education teachers.
Licensing: The discussion centered around what teacher standards need to be tested.
Dykstra suggested that the Knowledge and Practice Standards for Teachers of Reading, written by Louisa Moats, et al, and published by the International Dyslexia Association in 2010, would be good teacher standards, and the basis for a teacher competency exam. There was no need for DPI to spend the next year discussing and inventing new teacher standards.
Champeau said that the International Reading Association also has standards.
Pedriana asked if those standards are based on research.
Dykstra suggested that the task force look at the two sets of standards side-by-side and compare them.
Professional Development: The facilitators looked for input on how professional development for practicing teachers should be targeted. Should the state target struggling teachers, schools, or districts for professional development?
Rep. Jason Fields felt all three needed to be targeted.
Heyde asked Levesque for more details on how Wisconsin could do professional development, when we often hear there is no money.
Levesque provided more detail on the state making reading a priority, building public/private partnerships, and being more creative with federal grant money (e.g., the 20% of each grant that is normally carved out by the state for administration). There should be a clear reading plan (Florida started with just two people running their initiative, and after a decade only has eight people), and all the spending should align with the plan to be effective. You cannot keep sending money down the hole. Additional manpower was provided by the provision that all state employees would get one paid hour per week to volunteer on approved reading projects in schools, and also by community service requirements for high school students.
Bragg suggested using the online Florida training modules, and perhaps combining them with modules from Louisiana.
Dykstra also suggested taking advantage of existing training, including LETRS, which was made widely available in Massachusetts. He also stressed the importance of professional development for principals, coaches, and specialists.
Bragg pointed out that many online training modules are free, or provided for a nominal charge that does not come close to what it would cost Wisconsin to develop its own professional development.
Lander said there were many Wisconsin teachers who don’t need the training, and it should not be punitive.
Champeau suggested that Florida spends way more money on education that Wisconsin, based on information provided by the NAEP.
Levesque clarified that Florida actually is below the national average in cost per student. The only reason they spend more than Wisconsin is that they have more students.
Rep. Steve Kestell stated that teachers around the entire state have a need for professional development, and it is dangerous to give it only to the districts that are performing the worst.
Sarah Archibald (sitting in for Sen. Luther Olsen) said it would be good to look at the value added in districts across the state when trying to identify the greatest needs for professional development. The new statewide information system should provide us with some of this value added information, but not at a classroom teacher level.
Evers commented that the state could require new teacher Professional Development Plans to include or be focused on reading.
Pils commented that districts can have low and high performing schools, so it is not enough to look at district data.
Champeau said that administrators also need this professional development. They cannot evaluate teachers if they do not have the knowledge themselves.
Dykstra mentioned a Florida guidebook for principals with a checklist to help them. He is concerned about teachers who develop PDP’s with no guidance, and spend a lot of time and money on poor training and learning. There is a need for a clearinghouse for professional development programs.
Screening/Intervention: One of the main questions here was whether the screening should be universal using the same tools across the state.
Champeau repeated a belief that there are districts who are doing well with the screening they are doing, and they should not be required to change or add something new.
Dykstra responded that we need comparable data from every school to use value added analysis, so a universal tool makes sense. He also said there was going to be a lot of opposition to this, given the statements against screening that were issued when Rep. Keith Ripp introduced legislation on this topic in the last biennium. He felt the task force has not seen any screener in enough detail to recommend a particular one at this time.
Heyde said we need a screener that screens for the right things.
Pils agreed with Dykstra and Heyde. She mentioned that DIBELS is free and doesn’t take much time.
Michele Erickson asked if a task force recommendation would turn into a mandate. She asked if Florida used a universal screener.
Levesque replied that Florida initially used DIBELS statewide, and then the FCRR developed the FAIR assessments for them. The legislature in Florida mandated the policy of universal kindergarten screening that also traces students back to their pre-K programs to see which ones are doing a better job. Wisconsin could purchase the FAIR assessments from Florida.
Archilbald suggested phasing in screening if we could not afford to do it all at once.
Evers supports local control, but said there are reasons to have a universal screener for data systems, to inform college programs, and to implement professional development.
Lander asked what screening information we could get from the WKCE.
Evers responded that the WKCE doesn’t start unitl third grade.
Dykstra said we need a rubric about screening, and who needs what type and how often.
Pedriana said student mobility is another reason for a universal screener.
There was consensus that early screening is important. Certainly by 4K or 5K, but even at age three if a system could be established. Possibilities mentioned were district-run screenings or pediatrician screenings.
Walker reminded the task force that it only makes sense to screen if you have the ability to intervene with something.
Mara Brown wasn’t sure that a universal screener would tell her anything more about her students than she already knows.
Levesque said she could provide a screening roadmap rubric for the task force.
No one on the task force had suggestions for specific interventions. The feeling was that it is more important to have a well-trained teacher. Both Florida and Oregon started evaluating and rating interventions, but stopped because they got bogged down. Wisconsin must also be careful about evaluations by What Works Clearinghouse, which has some problems.
Pedriana asked if the task force is prepared to endorse a model of instruction based on science, where failure is not an option.
The facilitator said this discussion would have to wait for later.
Early Childhood: The task force agreed that YoungStar should include more specific literacy targets.
Rep. Kestell felt that some district are opening 4K programs primarily for added revenue, and that there is wide variability in quality. There is a need to spend more time on this and decide what 4K should look like.
Evers said we should use the Common Core and work backward to determine what needs to be done in 4K.
Wrap-Up: Further discussion of early childhood will be put over to the next meeting, as will the societal issues and accountability. A meeting site has not yet been set, but Governor Walker indicted he liked moving around the state. The Governor’s aides will follow up as to locations and specific agenda. The next meeting will be Thursday, August 25. All meetings are open to the public.Related: An Open Letter to the Wisconsin Read To Lead Task Force on Implementing Common Core Academic Standards; DPI: “Leading Us Backwards” and how does Wisconsin Compare? www.wisconsin2.org.
Much more on Wisconsin’s Read to Lead Task Force, here.
Thinking about the Cost of Educating Students via the Madison School District, Virtual Schools and a Madison School Board Member Ed Hughes email to State Senator Fred Risser
Madison School Board member Ed Hughes sent me an e-mail pointing out another vexing problem with Wisconsin’s school funding system and how it penalizes the Madison district, which I’ve written about in the past. Hughes notes in his e-mail “This particular wrinkle of the state school financing system is truly nuts.”
Hughes is incensed that the IQ Academy, a virtual school operated by the Waukesha district, gets over $6000 in state aid for poaching students from the Madison district while total state aid for educating a student in a real school here at home is $3400. Waukesha makes a profit of about $500 per student at the expense of taxpayers here, Hughes says. And that’s including profits going to the national corporate IQ Academy that supplies the school’s programming.The complete text of Ed Hughes letter to Senator Risser:
Sen. Risser:
As if we needed one, here is another reason to be outraged by our state school financing system:
This week’s issue of Isthmus carries a full page ad on page 2. It is sponsored by “IQ Academy Wisconsin,” which is described as a “tuition-free, online middle and high school program of the School District of Waukesha, WI.” The ad invites our Madison students to open-enroll in their “thriving learning community.”
What’s in it for Waukesha? A report on virtual charter schools by the State Fiscal Bureau, released this week, sheds some light on this. The Madison school district gets a little more than $2,000 in general state aid for each of our students. If you include categorical aids and everything else from the state, the amount goes up to about $3,400/student.
However, if Waukesha (or any other school district) is successful in poaching one of our students, it will qualify for an additional $6,007 in state aid. (That was actually the amount for the 2007-08 school year, that last year for which data was available for the Fiscal Bureau report.) As it was explained to me by the author of the Fiscal Bureau report, this $6,007 figure is made up of some combination of additional state aid and a transfer of property taxes paid by our district residents to Waukesha.
So the state financing system will provide nearly double the amount of aid to a virtual charter school associated with another school district to educate a Madison student than it will provide to the Madison school district to educate the same student in an actual school, with you know, bricks and mortar and a gym and cafeteria and the rest.
The report also states that the Waukesha virtual school spends about $5,500 per student. So for each additional student it enrolls, the Waukesha district makes at least a $500 profit. (It’s actually more than that, since the incremental cost of educating one additional student is less than the average cost for the district.) This does not count the profit earned by the private corporation that sells the on-line programming to Waukesha.
The legislature has created a system that sets up very strong incentives for a school district to contract with some corporate on-line operation, open up a virtual charter school, and set about trying to poach other districts’ students. Grantsburg, for example, has a virtual charter school that serves not a single resident of the Grantsburg school district. What a great policy.
By the way, Waukesha claims in its Isthmus ad that “Since 2004, IQ Academy Wisconsin students have consistently out-performed state-wide and district averages on the WKCE and ACT tests.” I didn’t check the WKCE scores, but last year 29.3% of the IQ Academy 12th graders took the ACT test and had an average composite score of 22.9. In the Madison school district, 56.6% of 12th graders took the test and the district average composite score was 24.0.
I understand that you are probably tired of hearing from local school board members complaining about the state’s school funding system. But the enormous disparity between what the state will provide to a virtual charter school for enrolling a student living in Madison, as compared to what it will provide the Madison school district to educate the same student, is so utterly wrong-headed as to be almost beyond belief.
Ed Hughes
Madison School BoardAmy Hetzner noted this post on her blog:
An interesting side note: the Madison Metropolitan School District’s current business manager, Erik Kass, was instrumental to helping to keep Waukesha’s virtual high school open and collecting a surplus when he was the business manager for that district.
I found the following comments interesting:
An interesting note is that the complainers never talked about which system more effectively taught students.
Then again, it has never really been about the students.Madison is spending $418,415,780 to educate 24,295 students ($17,222 each).
Related: Madison School District 2010-2011 Budget: Comments in a Vacuum? and a few comments on the recent “State of the Madison School District” presentation.
The “Great Recession” has pushed many organizations to seek more effective methods of accomplishing their goals. It would seem that virtual learning and cooperation with nearby higher education institutions would be ideal methods to provide more adult to student services at reduced cost, rather than emphasizing growing adult to adult spending.
Finally Richard Zimman’s recent Madison Rotary talk is well worth revisiting with respect to the K-12 focus on adult employment.
Fascinating.
Wisconsin State & School Finance Climate Update
I recently had an opportunity to visit with Todd Barry, President of the Wisconsin Taxpayers Alliance [29 minute mp3]. A summary of this timely conversation follows:
[2:25] Post Retirement Liabilities: Milwaukee Public Schools Post Retirement Health Care Liabilities: $2.2 to $2.5 billion
[3:01] Wisconsin’s $2.44 Billion structural deficit. The State debt load ($4billion to $9billion from 2000 to 2007) is now among the top 10.
[7:48] On property values and assessment changes. Two years ago, property values grew 9%, last year 6%, 3% this year with most of the recent growth coming from commercial properties.
[8:57] Wisconsin Income Growth: Per Capita personal income “The canary in the mineshaft” and how we lag the national average by 6% or more.
Why?
The population is aging. Senior population will double by 2030. School age population is stagnant.
Employment growth peaked before the nation (04/05)
Wisconsin wages per worker is about 10% less than the national average. 1969; 4% below national average, 1980’s; 10 or 11% below national average. Wisconsin wagers per worker are now 14% below national average. We’ve been on a 40 year slide.
We’ve hid this because the labor force participation of women has increased dramatically.
Wisconsin is losing corporate headquarters.
[18:18] What does this all mean for K-12 spending?
“If there is going to be growth in any state appropriation,it is going to be schools and Medicaid“. The way the Legislature and Governor have set up these two programs, they are more or less on auto-pilot. They will grab whatever money is available and crowd out most everything else. So you get this strange situation where state aid to schools has tripled in the last 25 years while funding for the UW has barely doubled. That sounds like a lot, but when you look at it on a year by year basis, that means state funding for the University of Wisconsin System has grown less than the rate of inflation on an annual average basis while school aids has outpaced it (inflation) as has Medicaid.”
Is there anything on the horizon in terms of changes in school finance sources? A discussion of shifting state school finance to the sales tax. “It’s clear that in states where state government became even more dominant (in K-12 finance) than in Wisconsin, the net result, in the long run, was a slowing of state support for schools. The legislature behaves like a school board, micromanaging and mandating. California is the poster child.
[20:52] On why the Madison School District, despite flat enrollment and revenue caps, has been able to grow revenues at an average of 5.25% over the past 20 years. Barry discussed: suburban growth around Madison, academic competition amongst Dane County high schools. He discussed Madison’s top end students (college bound kids, kids of professionals and faculty) versus the “other half that doesn’t take those (college entrance) tests” and that the “other half” is in the bottom 10 to 20% while the others are sitting up at the top on college entrance exams.
[23:17]: This is a long way of saying that Madison has made its problem worse and has put itself on a course toward flat enrollment because of social service policies, school boundary policies and so forth that have pushed people out of the city.
[23:42] “If there is a way within state law to get around revenue caps, Madison has been the poster child”. Mentions Fund 80 and frequent and successfully passing referendums along with Madison’s high spending per pupil.
People think of the Milwaukee Public Schools as a high spending District. When you really look start to dig into it, it is above average, but Madison is way out there compared to even MPS. People argue that argue that MPS is top heavy in terms of administrative costs per student, Madison actually spends more in some of those categories than Milwaukee. (See SchoolFacts, more)
[26:45] On K-12 School finance outlook: The last time we blew up the school finance system in Wisconsin was in 1994. And, it happened very quickly within a span of 2 to 3 months and it had everything to do with partisan political gotcha and it had nothing to do with education.
[28:26] “Where are the two bastians of Democratic seats in the legislature? Madison and Milwaukee. Madison is property rich and Milwaukee is relatively property poor. Somehow you have to reconcile those two within a Democratic environment and on the Republican side you have property rich suburbs and some very property poor rural districts.
WSJ: Texas School Finance Lesson
Wall Street Journal Review and Outlook: The Texas Supreme Court did the expected last week and struck down the statewide property tax for funding public schools. But what was surprising and welcome was the Court’s unanimous ruling that the Texas school system, which spends nearly $10,000 per student, satisfies the funding “adequacy” requirements of the […]